


5 Signs Your Tank Cleaning System Needs Upgrading
Industrial tank cleaning accounts for 15–25% of total processing time in food, beverage, chemical, and pharmaceutical facilities. After auditing 40+ manufacturing sites across three continents, I have consistently observed that outdated cleaning systems waste 40–60% more water, extend cleaning cycles by 2–3×, and create contamination risks that jeopardize product quality and regulatory compliance.
This article identifies five concrete warning signs that your tank cleaning system requires immediate attention, backed by operational data and ROI analysis from actual facility upgrades.
Table of Contents
1. Incomplete Cleaning Coverage and Residue Problems
The most critical indicator of system failure: visible residues or contamination after cleaning cycles complete.
Dead Zones and Shadow Areas occur when spray patterns fail to reach all interior surfaces. Static spray balls create predictable blind spots near mounting flanges, agitator shafts, and baffles. One dairy processor discovered that 12% of their 8,000-gallon tanks contained milk protein deposits in upper corners—areas the spray ball jets never contacted despite 40-minute cleaning cycles.
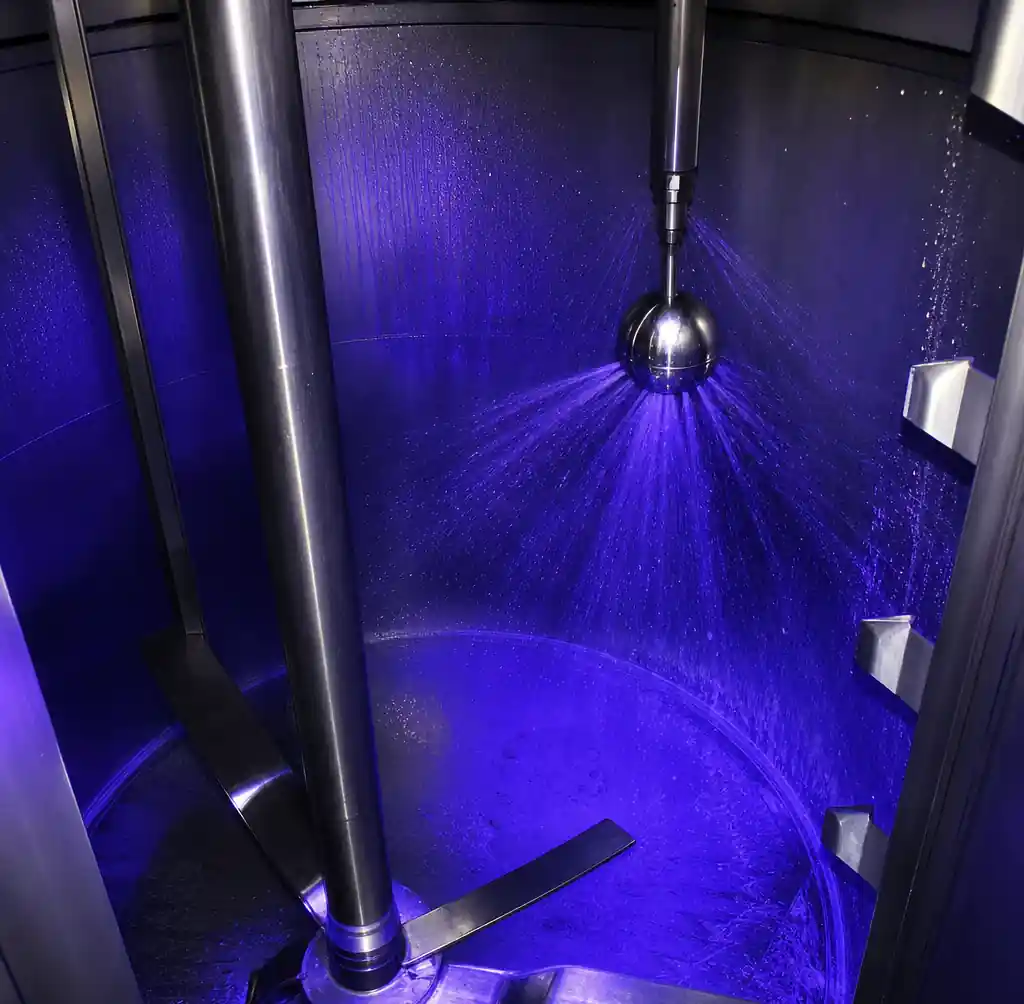 Static spray ball in industrial tank showing coverage dead zones around agitator shaft
Stubborn Residue Accumulation signals insufficient impact force. Spray balls generate 2–5 PSI at the tank wall—adequate for light soils but ineffective against baked-on proteins, caramelized sugars, or mineral scales. Modern rotary jet heads deliver 30–50 PSI impact, removing residues that resist static systems.
| Cleaning Issue | Static Spray Ball | Rotary Spray Head | Rotary Jet Head |
|---|---|---|---|
| Coverage Area | 75–88% typical | 92–96% typical | 97–99.5% typical |
| Dead Zones | Common near mounting points | Minimal with proper sizing | Virtually eliminated |
| Impact Force | 2–5 PSI | 15–25 PSI | 30–50 PSI |
| Protein Removal | 95–98% in 35–45 min | 98–99% in 18–25 min | 99.5%+ in 10–15 min |
| Mineral Scale | Requires acid soak | Removes with extended cycle | Removes in standard cycle |
Validation Testing quantifies the problem. ATP monitoring measures residual organic contamination—clean surfaces read <10 RLU (Relative Light Units). Failed cleaning cycles show 30–500+ RLU. Riboflavin tracing under UV light reveals exact coverage gaps, documenting which tank areas receive inadequate spray exposure.
If your facility requires repeated cleaning cycles or manual intervention to achieve acceptable cleanliness, your cleaning system lacks adequate coverage or impact force.
2. Excessive Water and Chemical Consumption
Cleaning systems designed 15–20 years ago consume 2–4× more resources than modern high-efficiency alternatives.
Water Consumption Benchmarks reveal system inefficiency. Older spray ball systems require 0.8–1.2 gallons per cubic foot of tank volume. A 10,000-gallon tank consumes 1,070–1,600 gallons per cleaning cycle. Modern rotary designs achieve 0.3–0.5 gallons per cubic foot—same tank, 400–670 gallons per cycle.
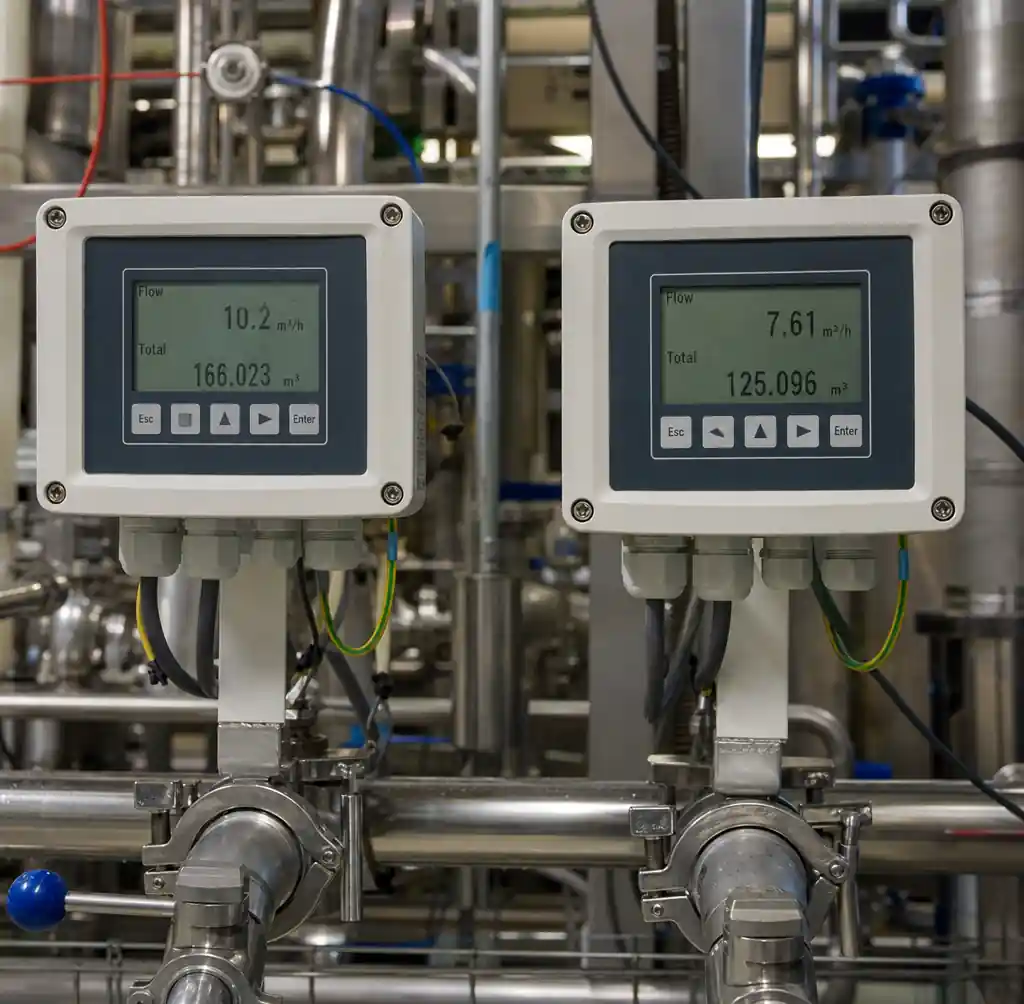 Flow meter measurement comparing water usage between spray ball and rotary nozzle systems
For a facility cleaning 20 tanks daily, this represents 3.35–4.65 million gallons annual savings. At $0.01/gallon for water and sewer, that is $33,500–$46,500 yearly from water costs alone. Heating energy adds another $23,600 annual savings when reducing water consumption 50%.
Chemical Usage Efficiency depends on distribution uniformity. One beverage facility reduced caustic consumption from 28 gallons to 16 gallons per cycle by upgrading to rotary jet heads that distributed chemicals uniformly across all surfaces.
If your utility bills show water consumption exceeding 0.7 gallons per cubic foot of tank volume, or chemical costs rising 15–30% year-over-year, system inefficiency is costing measurable operational expense.
3. Extended Cleaning Cycle Times
Time lost to cleaning directly reduces production capacity and revenue generation.
Cleaning Duration Comparison shows dramatic differences between technologies. For a 10,000-gallon stainless steel tank with moderate protein soiling:
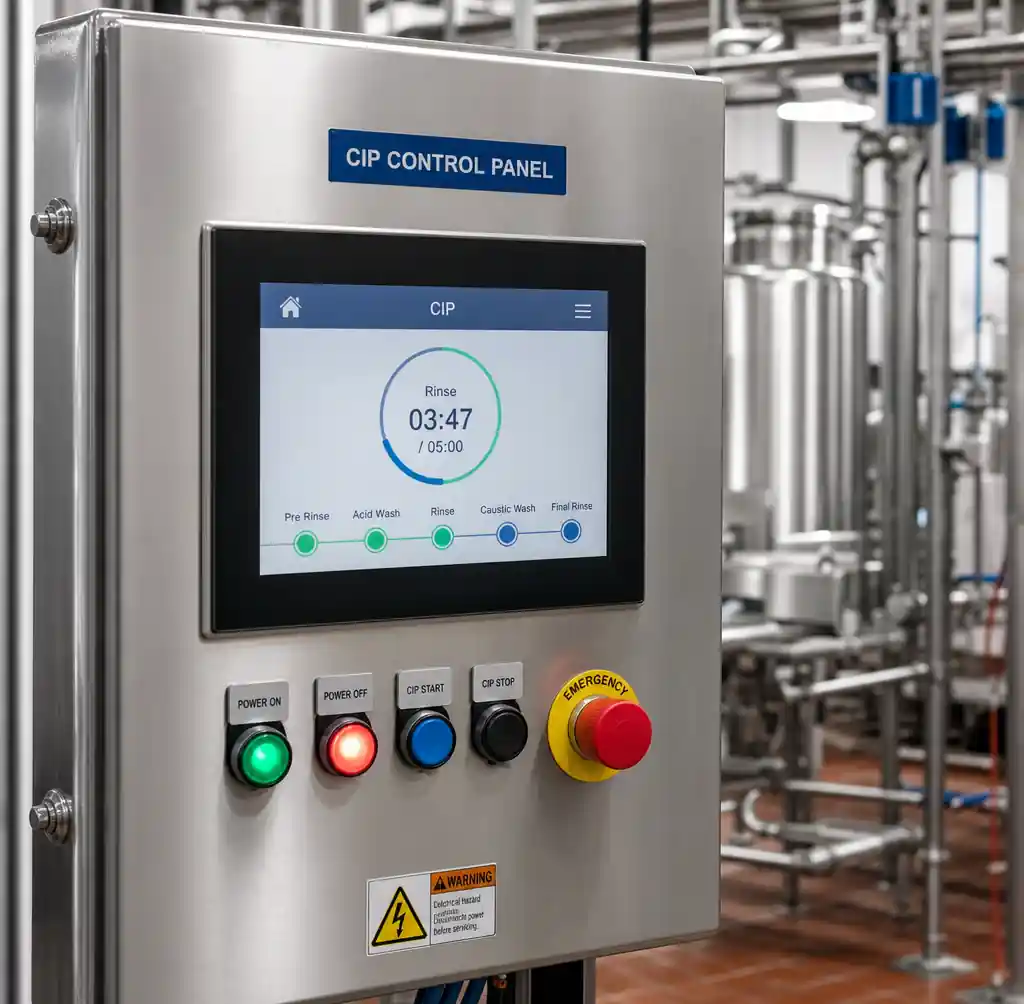 CIP system control panel displaying cleaning cycle timer and process stages
- Static spray ball: 35–50 minutes total cycle time
- Rotary spray head: 18–28 minutes total cycle time
- Rotary jet head: 10–18 minutes total cycle time
A brewery cleaning 18 fermentation tanks between batches demonstrated the financial impact. Original spray ball system required 45 minutes per tank (13.5 hours total). Rotary jet head upgrade reduced cleaning to 15 minutes per tank (4.5 hours total)—recovering 9 hours per changeover.
Production Capacity Impact translates cleaning time into revenue. If your processing line generates $15,000 profit per hour, each minute saved represents $250 in potential production value. A facility saving 25 minutes per tank across 20 daily cycles recovers 8.3 hours—substantial capacity for additional production runs.
| Tank Size | Spray Ball Time | Rotary Jet Time | Time Savings | Annual Savings (4 cycles/day, 250 days) |
|---|---|---|---|---|
| 2,000 gal | 22–30 min | 8–12 min | 14–18 min | 233–300 hours |
| 5,000 gal | 30–42 min | 10–16 min | 20–26 min | 333–433 hours |
| 10,000 gal | 35–50 min | 12–18 min | 23–32 min | 383–533 hours |
| 20,000 gal | 45–65 min | 15–24 min | 30–41 min | 500–683 hours |
If your cleaning cycles extend beyond industry benchmarks, you are sacrificing production capacity and operational efficiency.
4. Recurring Contamination and Quality Issues
Cleaning system failures manifest as contamination events, batch rejections, and regulatory non-compliance.
Microbial Contamination develops when cleaning systems fail to eliminate biofilms. ATP testing reveals the problem: clean surfaces measure <10 RLU, but inadequate cleaning leaves 30–500+ RLU residual organic matter where bacteria colonize. One juice processor experienced recurring Listeria contamination traced to spray ball dead zones where biofilms persisted despite daily CIP cycles.
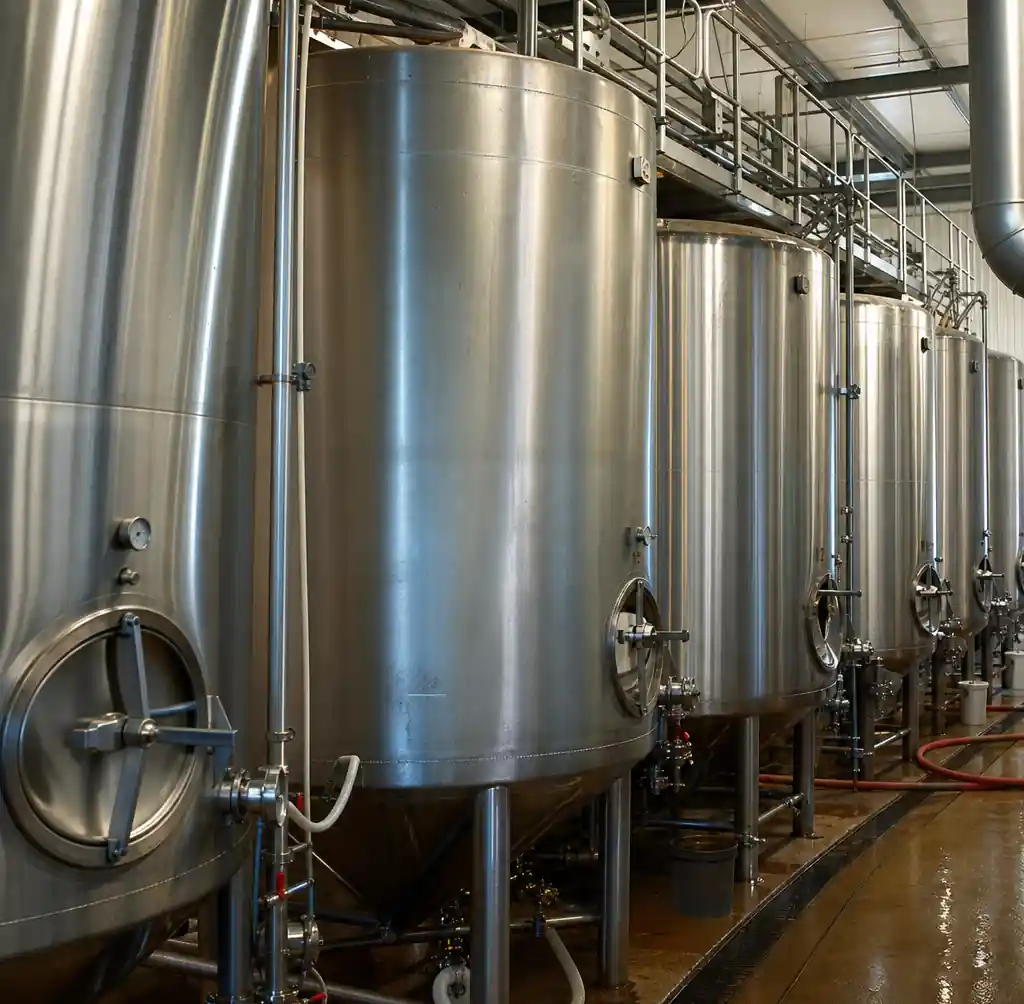 Industrial fermentation tanks in brewery showing multiple vessels requiring cleaning
Cross-Contamination Between Products occurs when previous batch residues remain. Allergen carryover creates severe regulatory risks—one facility received FDA warning letter after peanut protein appeared in a "peanut-free" product line due to inadequate tank cleaning.
Regulatory Compliance Failures result from cleaning system inadequacy: FDA inspections citing cleaning validation failures, 3-A sanitary standard violations, failed ATP verification testing, and environmental monitoring showing persistent contamination patterns.
Quality Impact Metrics quantify contamination risk:
| Indicator | Acceptable Performance | Warning Level | Critical Failure |
|---|---|---|---|
| ATP Testing | <10 RLU | 10–30 RLU | >30 RLU |
| Protein Residue | <0.5 mg/L rinse water | 0.5–2.0 mg/L | >2.0 mg/L |
| Bacterial Count | <1 CFU/cm² | 1–10 CFU/cm² | >10 CFU/cm² |
| Visual Inspection | No visible residue | Trace film | Visible deposits |
| Allergen Testing | Below detection limit | Detectable traces | Quantifiable levels |
One pharmaceutical manufacturer documented cleaning system inadequacy after three consecutive batches failed endotoxin specifications. Investigation revealed aging spray balls left 8–15% of tank surfaces inadequately cleaned, allowing bacterial endotoxin accumulation. Upgrading to rotary tank cleaning nozzles with verified 99.5% coverage eliminated the contamination source.
If your facility experiences recurring positive environmental monitoring or cleaning validation failures, your cleaning system likely lacks adequate coverage or impact force.
5. Rising Operational Costs and Maintenance Frequency
Aging cleaning systems impose increasing financial burden through maintenance expenses and operational inefficiency.
Maintenance Cost Escalation signals system obsolescence. Track spray ball hole plugging requiring monthly cleaning, bearing replacements every 6–12 months (quality rotary jet heads last 3–5 years), seal failures, pressure drops indicating corrosion, and parts availability issues.
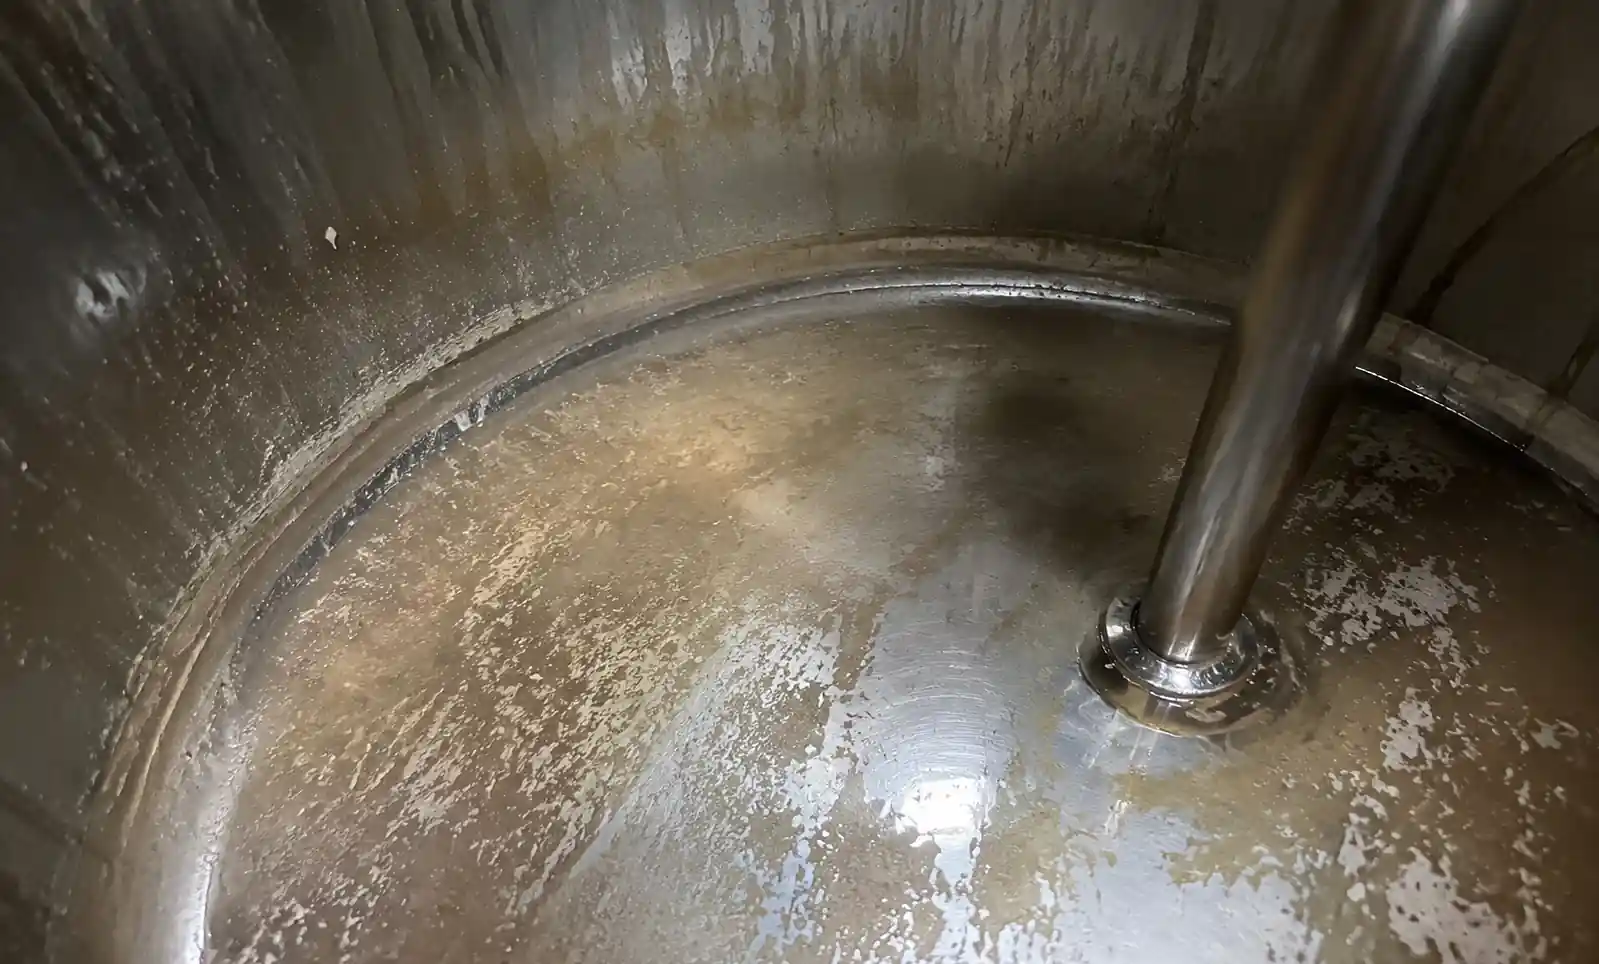 Tank interior surface showing biofilm formation and residue buildup from inadequate cleaning
One chemical processor's 25-year-old spray ball system cost $30,800 annually for maintenance (replacements, gaskets, labor). A new rotary jet head system required $4,500 annual maintenance—$26,300 annual savings.
Total Cost of Ownership comparison over 10 years reveals true system economics:
| Cost Category | Aging Spray Ball System | Modern Rotary Jet System | Annual Savings |
|---|---|---|---|
| Water (5M gal/yr @ $0.01/gal) | $50,000 | $22,500 | $27,500 |
| Heating energy | $45,000 | $20,000 | $25,000 |
| Chemicals | $180,000 | $120,000 | $60,000 |
| Maintenance | $30,000 | $4,500 | $25,500 |
| Production time lost | $95,000 | $35,000 | $60,000 |
| Total Annual Operating Cost | $400,000 | $202,000 | $198,000 |
| 10-year TCO | $4,000,000 | $2,020,000 | $1,980,000 |
System upgrade capital cost: $85,000–$150,000 (depending on tank quantity)
Payback period: 5–9 months
10-year ROI: 1,220–2,229%
If your facility experiences maintenance calls more than quarterly or total cleaning system operating costs exceeding $50 per tank per cycle, financial analysis will support immediate system upgrade.
FAQ
Q: How do I know if my cleaning system meets current hygiene standards?
Conduct ATP validation testing across all interior tank surfaces, including known dead zones near mounting points and baffles. Clean surfaces should measure <10 RLU. Results above 30 RLU indicate inadequate cleaning. Verify compliance with 3-A sanitary standards for surface finish (≤32 Ra microinches), self-draining design, and accessibility for inspection.
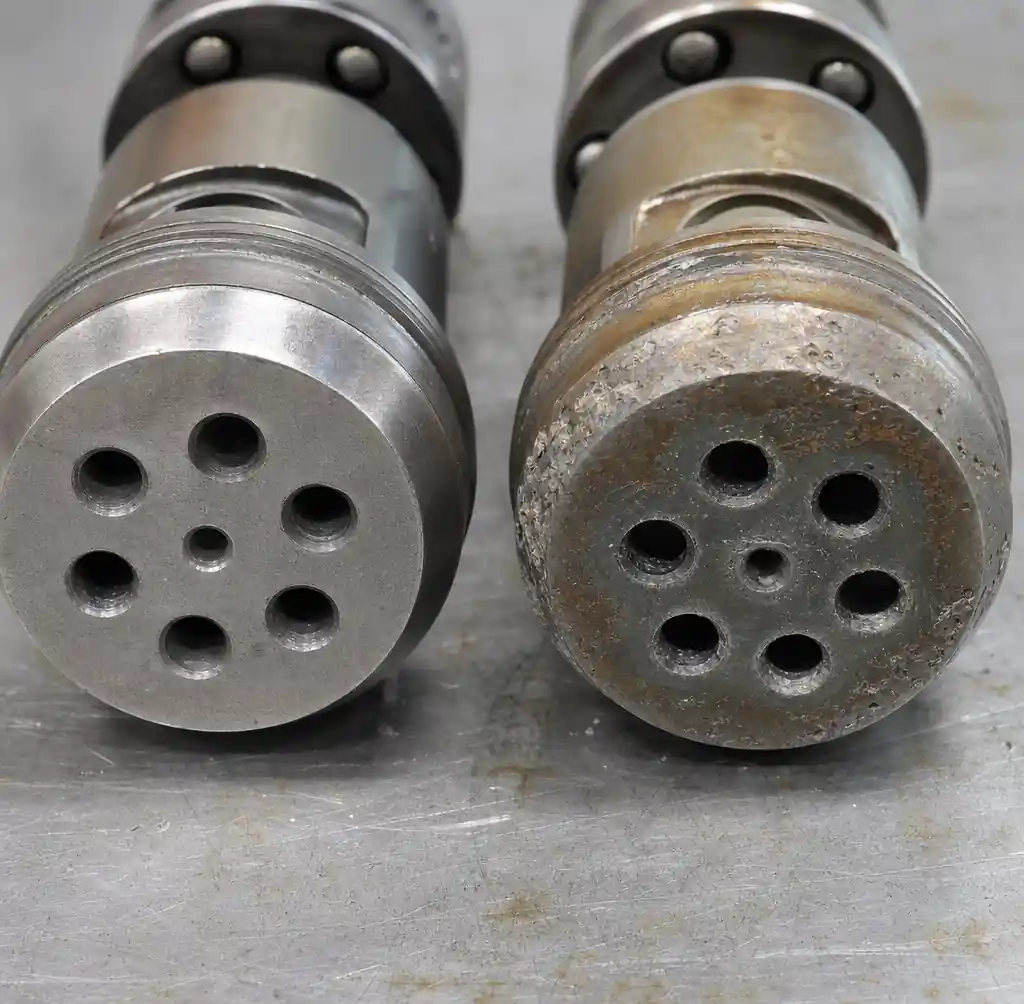 Worn and damaged spray ball showing eroded spray holes and mechanical wear
Q: What is the typical payback period for tank cleaning system upgrades?
Payback periods range from 5–18 months depending on current system inefficiency. Facilities with severe problems (>1.0 gal/cubic foot water consumption, >40 minute cleaning cycles, contamination issues) achieve 5–9 month payback. Moderately inefficient systems show 12–18 month payback.
Q: Can I upgrade individual tanks or must I replace the entire CIP system?
Tank-by-tank upgrades are feasible if your CIP pump capacity supports modern nozzle flow and pressure requirements. Rotary jet heads typically require 60–150 PSI at 10–25 GPM per tank. If your existing CIP skid delivers adequate flow and pressure, you can retrofit individual tanks with modern nozzle technology.
Q: What ROI should I expect from upgrading to rotary jet head technology?
Typical ROI ranges from 150–250% annually across water savings (30–60% reduction), energy savings (30–55% reduction), chemical savings (20–40% reduction), and production time recovery (40–65% cleaning time reduction). One brewery documented 58% cleaning time reduction and $127,000 total annual operating cost reduction from an $89,000 system upgrade—143% first-year ROI.
Q: How do modern cleaning systems prevent contamination issues?
Modern rotary jet heads achieve 97–99.5% coverage compared to 75–88% for spray balls, eliminating dead zones where biofilms establish. Higher impact force (30–50 PSI vs 2–5 PSI) removes stubborn residues and disrupts biofilm formation. Automation integration enables validated, repeatable cleaning cycles with documented compliance.
Conclusion
Tank cleaning system inadequacy manifests through incomplete coverage creating contamination risks, excessive resource consumption driving operational costs, extended cleaning cycles reducing production capacity, and rising maintenance expenses signaling obsolescence. These five warning signs—individually or in combination—indicate immediate action required to optimize cleaning performance and reduce operating costs.
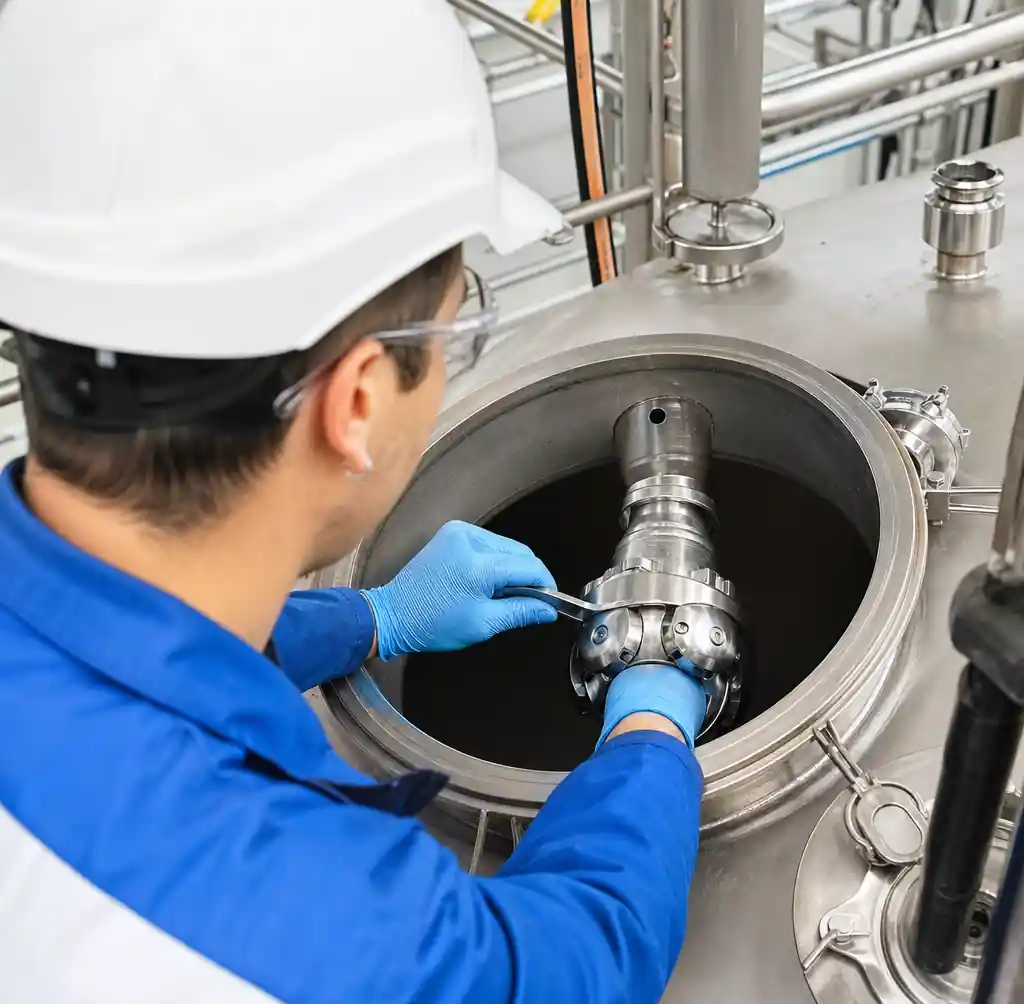 Maintenance technician inspecting tank cleaning equipment during scheduled service
Modern rotary jet head technology delivers 97–99.5% coverage, reduces water consumption 40–65%, cuts cleaning time 50–70%, and achieves payback periods of 5–18 months through operational savings. If your facility exhibits two or more warning signs, financial analysis will support system upgrade.
YuechenPrecision Technology manufactures comprehensive tank cleaning solutions from static spray balls to high-efficiency rotary jet heads for food, beverage, pharmaceutical, and chemical processing. Our application engineering team provides cleaning system audits, performance validation, and custom solutions optimized for your tank geometry and hygiene requirements.
Contact us today for tank cleaning system assessment, ROI analysis, and technical specifications that eliminate contamination risks while reducing operating costs 40–60%.
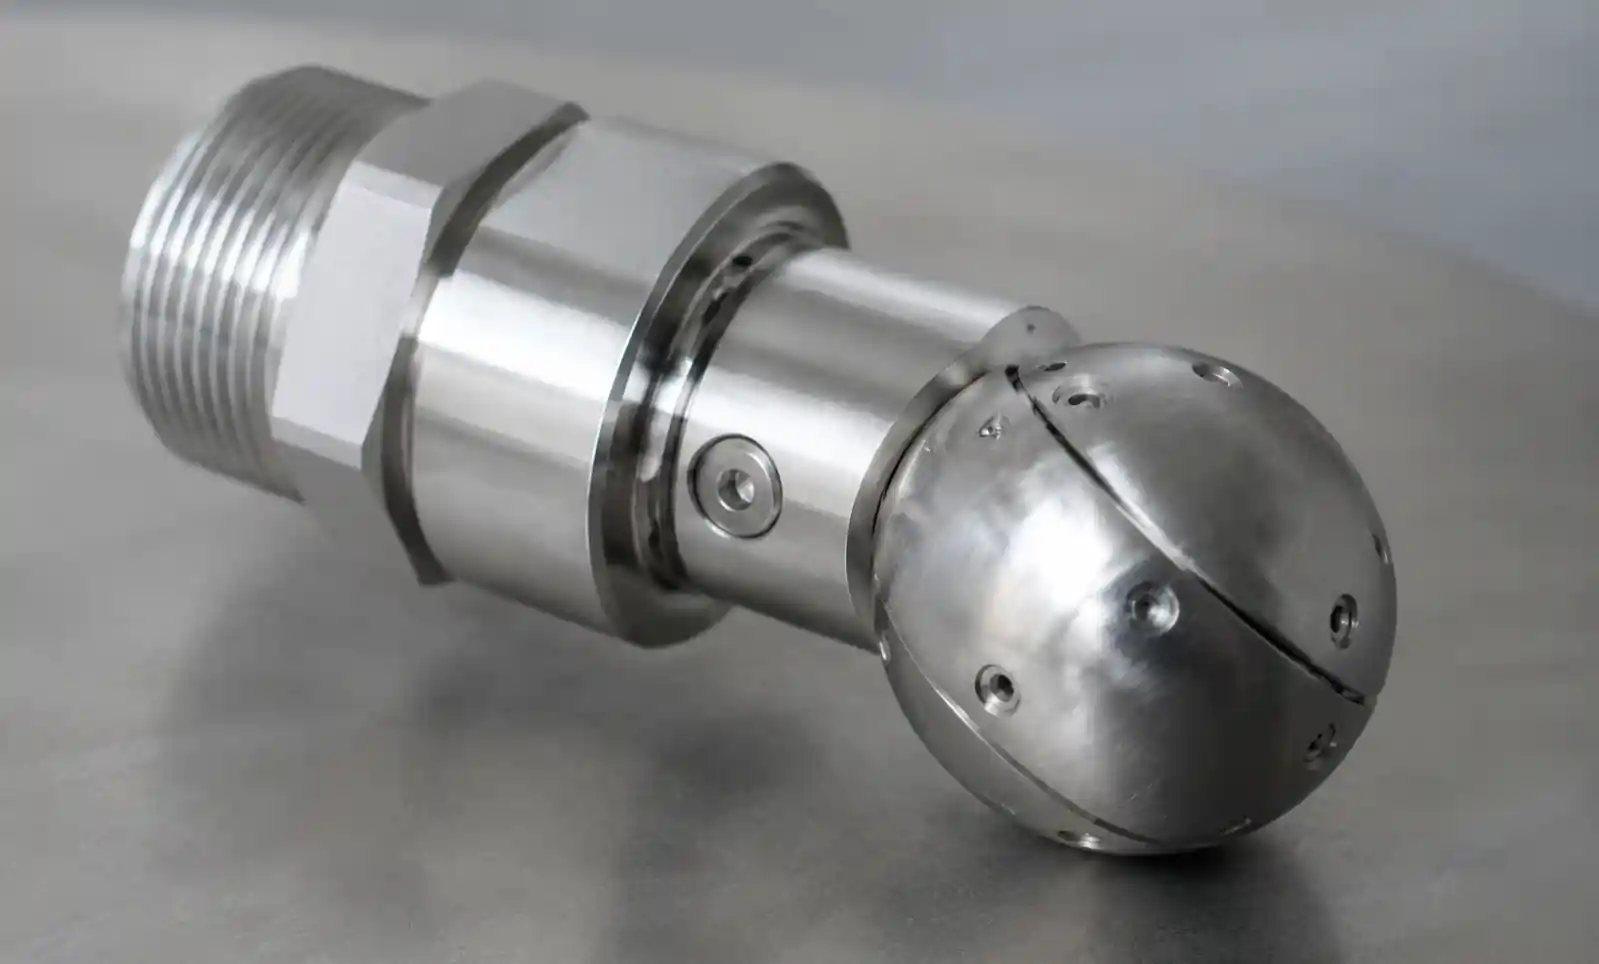 Modern rotary jet cleaning nozzle showing precision-engineered design and construction