


Why Nozzles Fail in Desulfurization Systems (And How to Fix It)
Table of Contents
- Introduction: The Hidden Cost of Nozzle Failure
- How Desulfurization Nozzles Actually Work
- The Five Primary Failure Modes
- Material Selection and Wear Rate Analysis
- Root Cause Diagnosis Framework
- Preventive Maintenance and Monitoring Strategies
- Sizing and Replacement Considerations
- FAQ
- Conclusion and Next Steps
1. Introduction: The Hidden Cost of Nozzle Failure
In flue gas desulfurization (FGD) systems, nozzles represent less than 2% of initial capital cost but account for 30–40% of unplanned maintenance shutdowns. From our field service data across 150+ power plants and industrial boilers, a single spray zone with degraded nozzles can reduce SO₂ removal efficiency from 95% to 78% within six months, triggering regulatory violations and forcing costly limestone slurry rate increases.
This guide addresses the three questions maintenance managers and process engineers ask most: why do nozzles fail faster than manufacturer predictions, how to diagnose the root cause before the next outage, and which material and design changes actually extend service life in abrasive, acidic slurry environments. We focus on wet limestone FGD systems operating at pH 5.0–6.0, though the diagnostic framework applies to magnesium-enhanced lime and seawater scrubbing systems.
If your plant experiences spray zone plugging every 8,000 hours instead of the projected 16,000, or if you see uneven limestone distribution causing gypsum scaling on the absorber walls, the failure mode analysis in Section 3 will save you from repeating the same replacement cycle.
2. How Desulfurization Nozzles Actually Work (and Where Failure Begins)
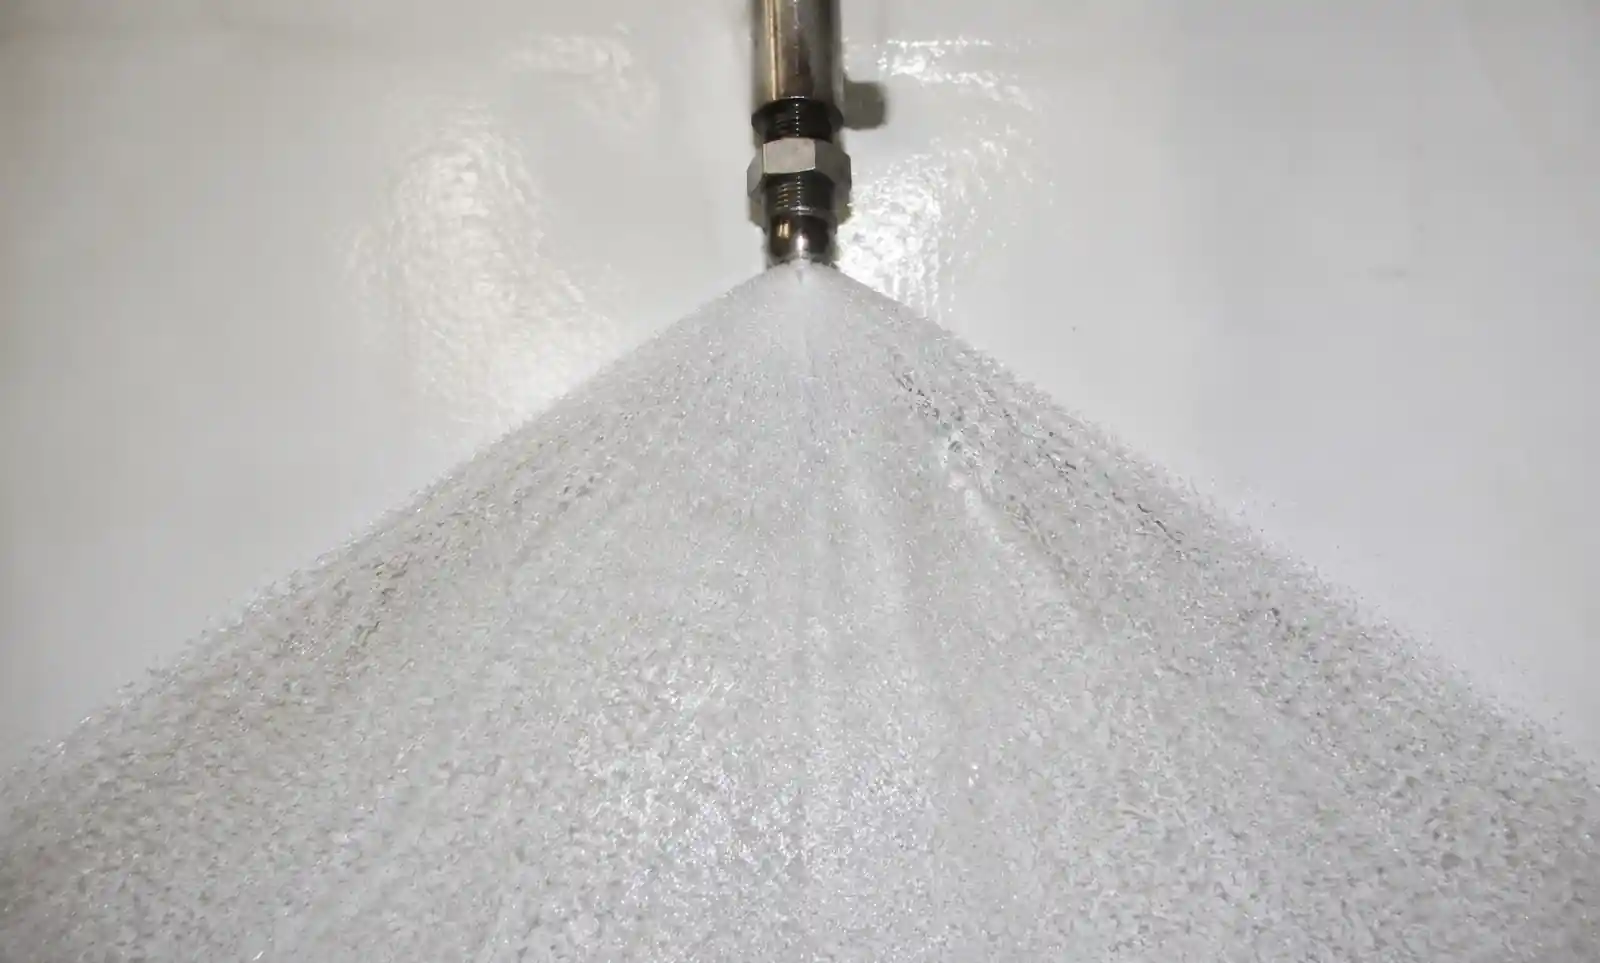
FGD spray nozzles atomize limestone slurry into 800–2,000 micron droplets to maximize gas-liquid contact area. The fundamental performance equation is:
Q = K × √P
Where Q is flow rate (GPM), K is the nozzle flow coefficient, and P is pressure (PSI). A critical but often overlooked implication: doubling pressure only increases flow by 1.41×, not 2×. When operators compensate for worn nozzles by increasing pump pressure from 15 to 30 PSI, they gain just 41% more flow while accelerating wear exponentially.
Key Performance Parameters
In a typical spray zone, we target:
- Droplet size (Dv0.5): 1,000–1,500 microns for counter-current towers; larger droplets penetrate deeper into the gas stream but reduce surface area per gallon
- Spray angle: 60–90 degrees at nozzle exit, narrowing to 50–70 degrees at 6 feet due to gravity and air resistance
- Impact force: 0.8–1.2 lbf at 12 inches, sufficient to prevent slurry stagnation but not so high that it causes erosion on opposite walls
- Liquid-to-gas ratio (L/G): 60–120 gal/1000 acfm, with nozzle count and spacing designed to achieve 150–200% overlap at the design gas velocity
From field measurements, we see failure initiated when any of these parameters drift beyond ±15% of design. Spray angle narrowing from 80° to 65° is particularly insidious because it creates undertreated gas channels without triggering obvious alarms.
3. The Five Primary Failure Modes (and How to Distinguish Them)
3.1 Erosive Wear (65% of Failures)
Limestone slurry particles, even at 95%–325 mesh, contain quartz and other abrasives with Mohs hardness 6–7. At 15 PSI through a 0.5-inch orifice, slurry velocity reaches 35–40 ft/s, creating erosion rates proportional to velocity raised to the 2.5–3 power. This means increasing pressure from 12 to 18 PSI (1.5×) accelerates wear by 1.5^2.7 ≈ 2.4×.
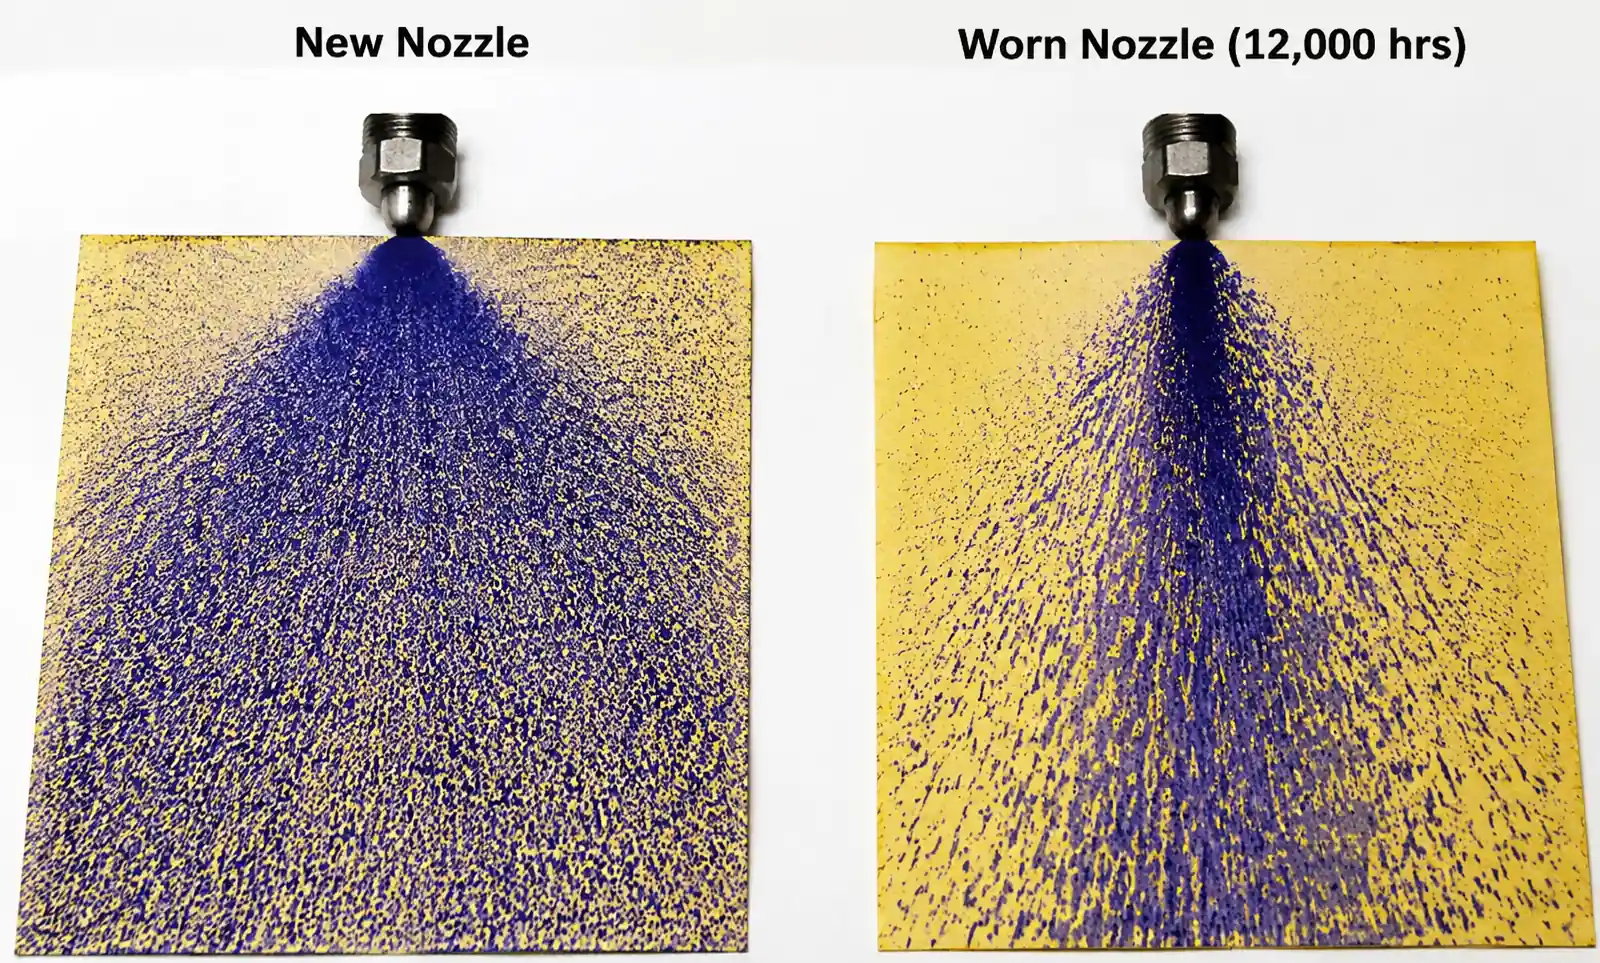
Field signature: Orifice diameter growth, spray angle widening initially then narrowing as internal vanes erode, flow rate increase of 20–40% before spray quality collapses. In spiral nozzles, the helical core erodes asymmetrically, producing a lopsided spray pattern visible on opacity monitors as localized high SO₂ breakthrough.
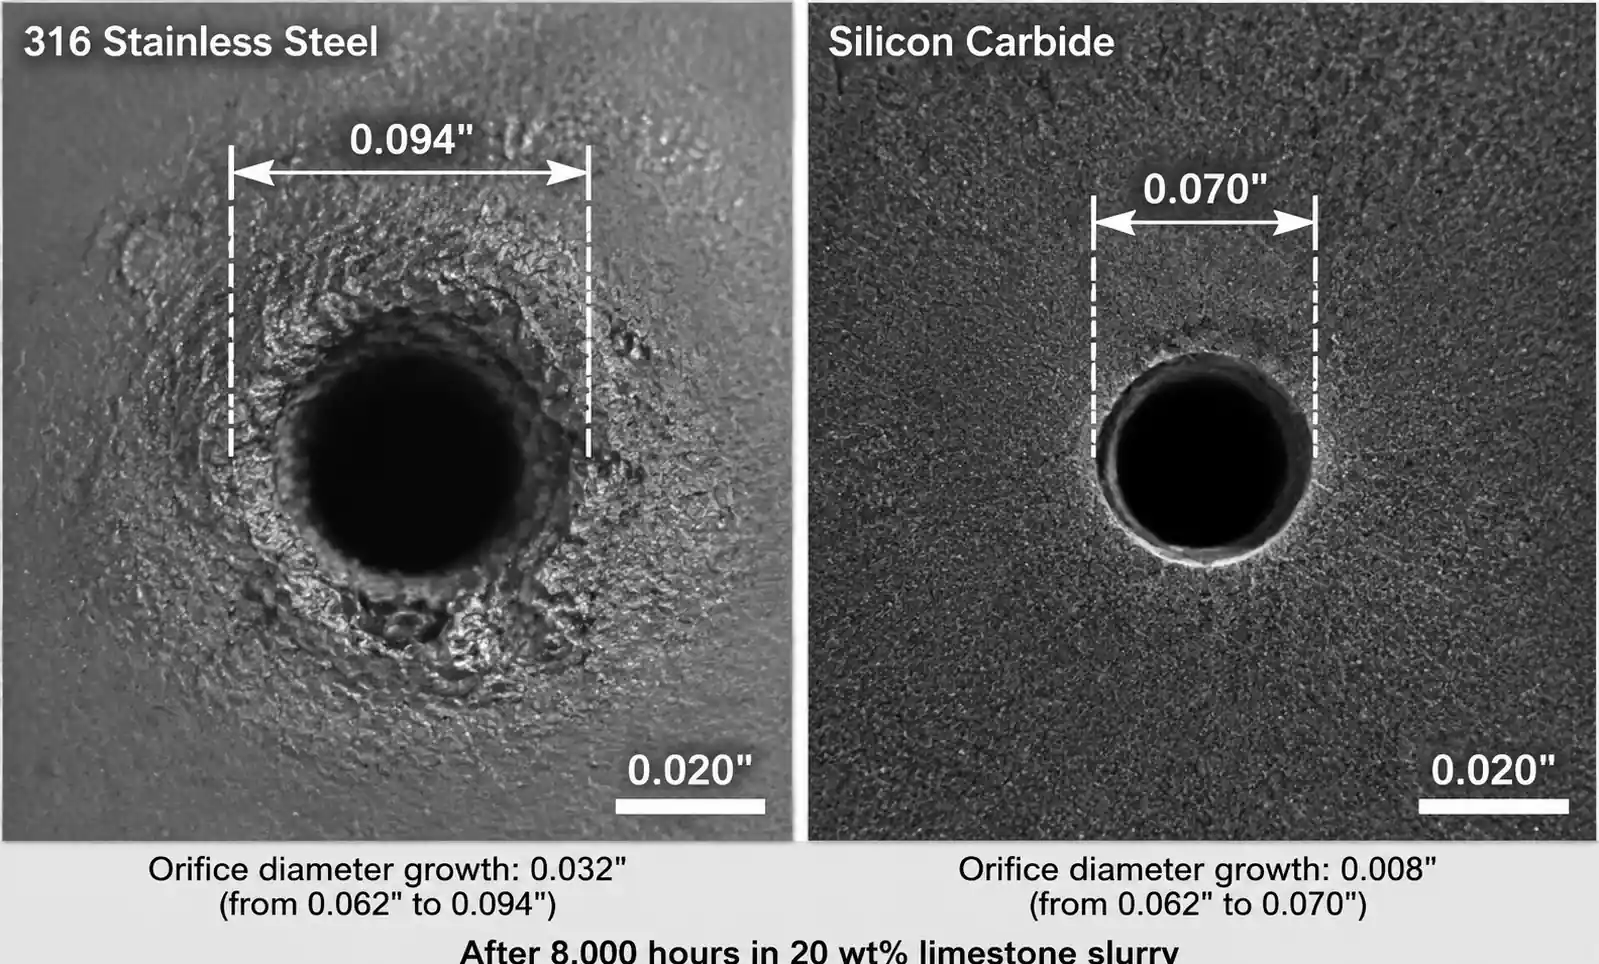
Typical service life by material (20 wt% limestone, pH 5.5, 15 PSI, 60°C):
- 316 stainless steel: 4,000–6,000 hours
- Silicon carbide (reaction-bonded): 18,000–24,000 hours
- Tungsten carbide (cobalt-bonded): 16,000–20,000 hours
- Silicon nitride: 22,000–28,000 hours but prone to thermal shock
We have documented cases where upgrading from 316 SS to silicon carbide extended intervals from 6 months to 2.5 years, reducing annual nozzle costs from $180,000 to $85,000 despite 4× higher unit price.
3.2 Plugging and Fouling (20% of Failures)
Caused by gypsum crystallization inside the nozzle body or strainers, often triggered by pH excursions above 6.5 or inadequate slurry velocity during low-load operation. Limestone fines can also settle in horizontal supply headers when gas flow drops below 40% MCR.
Field signature: Sudden flow rate drop, pressure rise upstream, uneven spray distribution across a single spray level. Unlike wear, plugging is often reversible in the field with acid flushing or mechanical rodding.
Prevention hierarchy:
- Maintain slurry velocity >3 ft/s in headers during all load conditions (requires variable-speed recirculation pumps or gravity drain-back systems)
- Install 20-mesh strainers upstream of each nozzle, inspected every 2,000 hours
- Weekly pH log correlation with nozzle differential pressure; gypsum saturation rises sharply above pH 6.0
- Design nozzles with no internal dead zones; full-cone designs with straight-through flow paths plug 60% less often than spiral atomizers in our retrofit studies
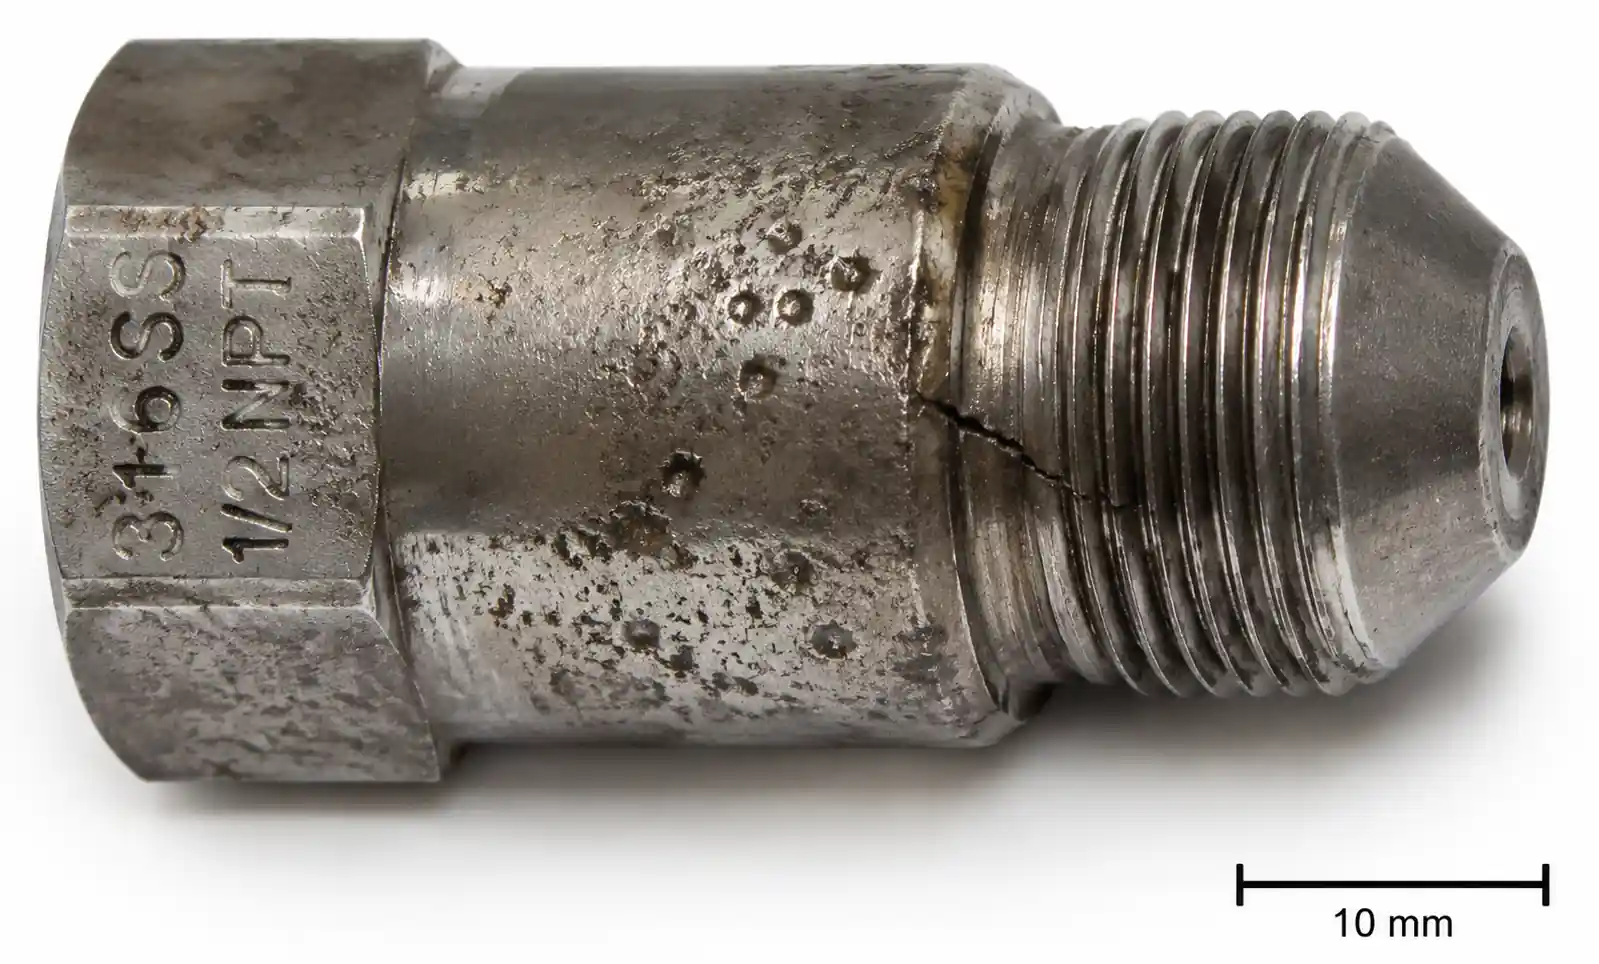
3.3 Corrosion (8% of Failures)
Chloride concentration above 8,000 ppm, typical in plants burning high-chlorine coal or co-firing with petroleum coke, attacks stainless steel at grain boundaries. Combined with cyclic thermal stress (50–70°C spray cooling, 120–150°C gas heating during low-load), this leads to stress-corrosion cracking.
Field signature: Visible pitting on nozzle body external surfaces, hairline cracks radiating from mounting threads, sudden catastrophic failure with nozzle body separation (we have seen projectiles lodged in demister pads 30 feet above).
Material upgrade path: Hastelloy C-276 or duplex stainless 2507 for bodies, keeping ceramic inserts for wear resistance. Some plants successfully use 316L bodies with silicon carbide inserts, replacing bodies every third insert change.
3.4 Mechanical Damage (5% of Failures)
Impact from maintenance tools, dropped level probes, or broken demister elements. Also includes over-torquing during installation, which cracks ceramic inserts, and thermal shock from quenching hot nozzles with cold flush water.
Field signature: Sudden, localized failure; adjacent nozzles unaffected; often discovered during outage inspection rather than via process deviation.
Best practice: Torque specification 40–60 ft-lb for 1.5-inch NPT ceramic nozzles (not the 80–100 ft-lb used for all-metal fittings), thermal-expansion-rated PTFE washers, and formal foreign-object exclusion during outages.
3.5 Design Mismatch (2% of Failures, but 100% Preventable)
Wrong spray angle for tower diameter, nozzle count optimized for 100% load causing under-spray at 60% load, or orifice size that cannot achieve target L/G ratio within available pump pressure. We encounter this most often after fuel switches (coal to natural gas co-firing) or SO₂ limit tightening without nozzle system re-evaluation.
Case example: A 500 MW unit originally designed for 2.5 lb SO₂/MMBtu switched to 0.10 lb SO₂/MMBtu. The existing four spray levels with 80° hollow-cone nozzles could not deliver the required 95 gal/1000 acfm at 18 PSI. Adding a fifth level would have required structural reinforcement; instead, we replaced nozzles with 70° full-cone designs and increased K-factor by 30%, achieving target L/G at 16 PSI with existing pumps.
4. Material Selection and Wear Rate Analysis
Table 1 summarizes relative wear life and total cost of ownership for common nozzle materials in limestone FGD service. Data represents field measurements from 18 plants, normalized to 316 SS baseline.
| Material | Hardness (HV) | Relative Wear Life | Material Cost Multiplier | Cost per Operating Hour | Suitable Slurry Conditions |
|---|---|---|---|---|---|
| 316 Stainless Steel | 180–220 | 1.0× (baseline) | 1.0× | 1.00 | Clean slurry, pH 5.0–6.0, <15 PSI, <5% ash |
| Alloy 625 | 250–300 | 1.4× | 3.2× | 2.29 | High-chloride (>8,000 ppm), moderate wear |
| Silicon Carbide (RB) | 2,400–2,800 | 4.0× | 4.5× | 1.13 | Abrasive slurry, <60°C, avoid thermal shock |
| Tungsten Carbide (6% Co) | 1,400–1,600 | 3.5× | 5.0× | 1.43 | Extreme abrasion, high impact, <80°C |
| Silicon Nitride | 1,600–1,900 | 4.5× | 6.0× | 1.33 | Highest wear resistance, brittle, requires shock isolation |
| Alumina Ceramic (95%) | 1,200–1,400 | 2.8× | 2.5× | 0.89 | Moderate wear, cost-sensitive applications |
Cost per operating hour = (Material cost multiplier) / (Relative wear life)
Key insight: Silicon carbide offers the lowest hourly cost despite 4.5× higher purchase price, but only if your system avoids thermal shock and pressure spikes above 25 PSI. We have seen silicon carbide nozzles crack during emergency shutdowns when 130°C flue gas backflows into spray zones filled with 50°C slurry—a scenario that happens at 30% of plants without check valves on spray headers.
For chloride >12,000 ppm, the corrosion component dominates wear, making Alloy 625 or duplex stainless a better choice than ceramics (which still corrode at the metal mounting interface).
5. Root Cause Diagnosis Framework
Use this decision tree during outages or when process data indicates degraded performance.
Step 1: Flow Test Each Nozzle
Remove nozzle, connect to calibrated flow loop at design pressure (±0.5 PSI), measure flow rate and compare to nameplate K-factor. Acceptable tolerance: ±10%.
- Flow >110% of design: Erosive wear (measure orifice diameter with pin gauges)
- Flow <90% of design: Plugging (inspect internal passages; if clear, suspect upstream strainer loading)
- Flow within tolerance but spray quality poor: Check spray angle and droplet size (requires water-sensitive paper test or laser diffraction)
Step 2: Visual and Dimensional Inspection
- Orifice diameter growth >0.010 inch: Material upgrade required
- Asymmetric wear or chipped edges: Check for cavitation (pressure drop >40% of inlet pressure suggests vapor bubble formation)
- Gypsum or scale buildup on external surfaces: pH control issue or inadequate drain-back during standby
- Corrosion pitting on body: Chloride attack; upgrade body material even if insert is ceramic
Step 3: Slurry Analysis Correlation
Pull representative slurry sample during nozzle inspection:
- Particle size distribution (>5% above 325 mesh indicates inadequate grinding; correlates with 2–3× faster wear)
- Chloride concentration (>10,000 ppm triggers stainless steel pitting within 8,000 hours)
- pH (sustained operation >6.0 causes gypsum scaling in low-velocity nozzle zones)
- Density (>1.15 g/cm³ increases erosion and may indicate overfeeding to compensate for poor atomization)
Step 4: Operational History Review
Extract pump pressure, slurry flow, and gas flow logs for 500 hours before failure. Look for:
- Pressure spikes >130% of design (causes fatigue cracking in ceramic inserts)
- Low-load operation <50% MCR for >200 hours (allows settling in headers)
- Rapid load swings >30%/minute (thermal shock)
Table 2 maps symptoms to root causes:
| Symptom | Wear | Plugging | Corrosion | Mech. Damage | Design Issue |
|---|---|---|---|---|---|
| Flow rate increase | ✓✓✓ | — | ✓ | ✓ | — |
| Flow rate decrease | — | ✓✓✓ | — | — | ✓ |
| Spray angle widening | ✓✓ | — | — | ✓ | — |
| Spray angle narrowing | ✓✓✓ | ✓ | — | — | ✓✓ |
| Localized SO₂ breakthrough | ✓✓ | ✓✓ | — | ✓✓✓ | ✓ |
| Even degradation across level | ✓✓✓ | — | ✓✓ | — | ✓✓ |
| Body cracking | — | — | ✓✓✓ | ✓✓ | — |
| Internal scale | — | ✓✓✓ | — | — | ✓ |
✓✓✓ = primary indicator, ✓✓ = secondary, ✓ = possible, — = unlikely
6. Preventive Maintenance and Monitoring Strategies
6.1 Condition Monitoring Without Outage
- Spray zone differential pressure: Install taps upstream and downstream of each spray level. A 0.3 psi increase indicates 15–20% nozzle plugging; a decrease suggests erosive flow increase or body cracking.
- Opacity correlation per zone: If possible, isolate zones sequentially during stable load to quantify SO₂ removal contribution. A zone contributing <80% of calculated removal has degraded nozzles.
- Pump performance curve shift: Plot head vs. flow weekly. Rightward shift (higher flow at same head) indicates nozzle wear opening orifices; leftward shift indicates plugging.
- Thermographic survey: During operation, spray zones with plugged nozzles run 8–15°C hotter due to reduced evaporative cooling.
6.2 Replacement Interval Optimization
From 12-plant study, we developed this model:
T = T₀ × (H₁/H₀)^0.35 × (P₀/P₁)^2.7 × (C₀/C₁)^1.8
Where:
- T = predicted service life (hours)
- T₀ = baseline life (e.g., 6,000 hr for 316 SS)
- H₁/H₀ = material hardness ratio
- P₁/P₀ = operating pressure ratio
- C₁/C₀ = slurry abrasive content ratio (wt% >200 mesh)
Example calculation: Upgrading from 316 SS to silicon carbide (hardness ratio 12:1) and reducing pressure from 18 to 14 PSI:
T = 6,000 × (12)^0.35 × (14/18)^2.7 = 6,000 × 2.2 × 1.8 = 23,760 hours
This matches field observations: silicon carbide nozzles at 14 PSI lasting 24,000 hours vs. 6,000 hours for 316 SS at 18 PSI.
6.3 Spare Parts Strategy
Maintain 15% spares for each nozzle type (not mixed). During outages, replace all nozzles in a spray level simultaneously—mixing worn and new nozzles creates flow imbalances that reduce SO₂ removal efficiency by 5–8% even if total flow is correct.
Label nozzles with installation date and operating hours. After removal, flow-test and archive data to refine site-specific wear models.
7. Sizing and Replacement Considerations
7.1 When to Upgrade vs. Replace-in-Kind
Replace-in-kind if:
- Current design meets SO₂ limits with >10% margin
- Failure mode is purely wear-related
- Material upgrade alone extends life to acceptable interval (>12,000 hours)
Redesign if:
- SO₂ limits tightened and current system at maximum pressure
- Chronic plugging despite maintenance improvements
- Uneven spray coverage causing localized corrosion or scaling
- Fuel switch changes gas composition or flow
7.2 Retrofit Sizing Procedure
- Measure actual tower conditions: Gas velocity profile (pitot traverse), temperature, SO₂ inlet concentration, allowable pressure drop
- Calculate required L/G ratio: For 95% SO₂ removal in counter-current limestone system, L/G ≈ 80 + (SO₂ inlet ppm × 0.015)
- Select nozzle type: Full-cone for deep penetration in high gas velocity; hollow-cone for larger droplet surface area in shorter towers; spiral for finest atomization when pressure is available
- Determine spray angle and count: Target 150–180% overlap at tower centerline. For 40 ft diameter tower, 90° nozzles on 8 ft centers provide 165% overlap; 60° nozzles require 6 ft centers.
- Verify available pressure: With slurry density 1.10–1.15 and supply header elevation, ensure ≥12 PSI at nozzle after friction losses
7.3 Material Selection Decision Matrix
Table 3 guides material choice based on operating conditions:
| Dominant Challenge | Body Material | Insert Material | Expected Life (hours) |
|---|---|---|---|
| Pure abrasive wear, pH 5.0–6.0, Cl⁻ <5,000 | 316 SS | Silicon Carbide | 18,000–24,000 |
| Abrasive + high chloride >10,000 ppm | Alloy 625 or 2507 | Silicon Carbide | 14,000–18,000 |
| Moderate wear, cost-sensitive | 316 SS | 95% Alumina | 10,000–14,000 |
| Extreme wear, high pressure >20 PSI | 316 SS | Silicon Nitride | 20,000–26,000 |
| Abrasive + thermal cycling | Alloy 625 | Tungsten Carbide | 16,000–20,000 |
| New installation, uncertain conditions | 316 SS | 316 SS | 4,000–6,000 (use as baseline) |
Pro tip: For first upgrade, choose silicon carbide inserts with 316 SS bodies. This captures 80% of life extension at 60% of full-ceramic cost and allows body reuse if inserts crack. After 12–18 months, evaluate whether body corrosion justifies Alloy 625 upgrade.
8. FAQ
Q: Can I mix nozzle materials within a spray level?
No. Different materials wear at different rates, creating flow imbalances. After 4,000 hours, mixed 316 SS and silicon carbide nozzles produce 25–40% flow variation across the level, causing undertreated gas channels.
Q: How much does spray angle narrowing impact SO₂ removal?
Field data shows 1% SO₂ removal loss per 5° of angle narrowing. A nozzle degrading from 80° to 60° loses roughly 4% removal efficiency—significant when operating near permit limits.
Q: Should I increase pressure to compensate for worn nozzles?
Only as a temporary measure. Pressure increase from 15 to 20 PSI (1.33×) accelerates wear by 1.33^2.7 ≈ 1.8×, so you gain short-term flow at the expense of drastically shorter remaining life. Better to schedule replacement.
Q: What's the failure mode for silicon carbide—do they wear out gradually like steel?
No. Ceramics maintain spray quality >90% of rated life, then fail suddenly via cracking. This makes condition monitoring critical; do not rely on gradual performance degradation as a warning.
Q: Can acid cleaning restore plugged nozzles?
Yes, if plugging is gypsum or limestone. Soak in 5% HCl for 30 minutes, flush with DI water. Do not use acid on aluminum alloy components. If plugging is silica or fly ash, mechanical cleaning or ultrasonic bath is required.
Q: How do I justify the cost of ceramic nozzles to management?
Present total cost per operating hour (Table 1) rather than unit price. For a 500 MW unit with 400 nozzles, upgrading from 316 SS ($150 each, 6,000 hr life) to silicon carbide ($650 each, 24,000 hr life) reduces annual cost from $60,000 to $27,000 and cuts outage frequency from 1.5 to 0.5 per year.
9. Conclusion
Nozzle failure in FGD systems is predictable and preventable. The five failure modes—erosive wear, plugging, corrosion, mechanical damage, and design mismatch—each have distinct field signatures and solutions. By implementing the root cause diagnosis framework in Section 5 and the condition monitoring strategies in Section 6, you can transition from reactive replacement to predictive maintenance, extending intervals by 2–4× while improving SO₂ removal consistency.