


Impact of L/G Ratio on Desulfurization Efficiency: How Nozzle Flow Rate Determines Absorber Tower Performance
Quick Answer
The liquid-to-gas (L/G) ratio is the critical parameter in wet FGD systems, determining SO₂ removal rates and absorber tower performance. Optimal values range from 15–25 L/m³, with nozzle flow rate as the primary control. Deviating beyond this range can reduce desulfurization efficiency by 12–30%.
Table of Contents
- 1. Understanding the Fundamentals of L/G Ratio in FGD Systems
- 2. The Hidden Costs of Improper Liquid-to-Gas Ratio Management
- 3. How Nozzle Flow Rate Engineering Solves the Control Challenge
- 4. Step-by-Step Guide to Optimizing Your Absorber Tower
- 5. Real-World Applications Across Industries
- 6. Frequently Asked Questions
- 7. Conclusion: Precision Nozzle Technology as Your Competitive Edge
1. Understanding the Fundamentals of L/G Ratio in FGD Systems
1.1 What Is the L/G Ratio and Why Does It Matter?
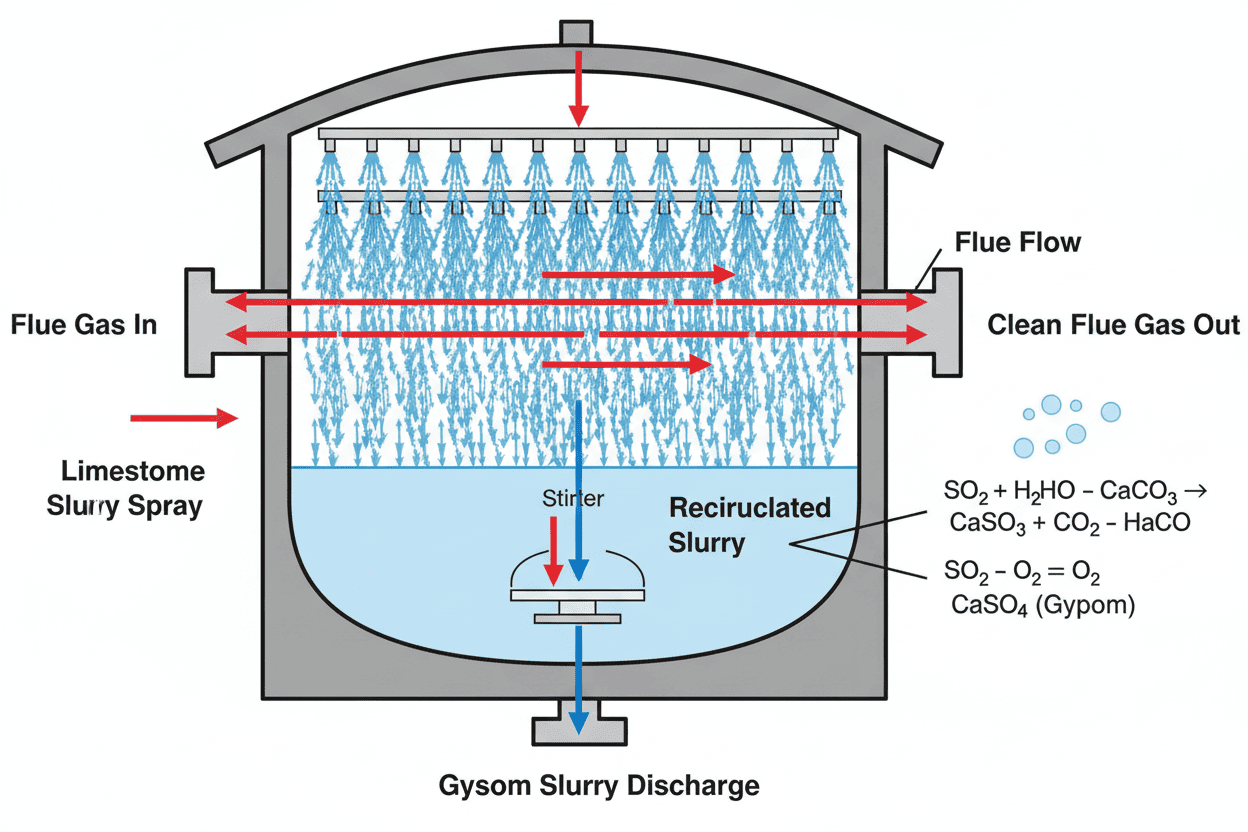
The liquid-to-gas ratio represents the volume of scrubbing liquid (typically limestone slurry) circulated per unit volume of flue gas processed within the absorber. Data indicates that this parameter functions as the single most controllable variable affecting removal performance across wet FGD installations worldwide.
In practical terms, this metric determines:
- Contact time between SO₂ molecules and the alkaline scrubbing medium
- Mass transfer driving force across the gas-liquid interface
- Slurry holdup volume within the reaction zone
- Overall system pressure drop and associated energy consumption
"The liquid-to-gas proportion is not merely a hydraulic parameter—it is the fundamental design variable that governs the thermodynamic and kinetic limits of SO₂ absorption." — Industrial & Engineering Chemistry Research
Analysis shows that most utility-scale absorbers operate with ratios between 15 and 25 L/m³. However, optimal values depend heavily on inlet SO₂ concentration, fuel sulfur content, and targeted removal performance. For high-sulfur coal applications exceeding 3% S content, operators may need values toward 30 L/m³ to maintain compliance-grade rates above 95%.
1.2 The Direct Correlation Between Nozzle Flow Rate and Liquid Distribution
The connection between nozzle flow rate and this critical ratio is mathematically straightforward yet operationally complex. The total liquid flow distributed across the absorber cross-section equals the sum of individual nozzle discharge rates multiplied by the count of active spray heads.
The governing equation:
Where Q_total represents the cumulative discharge (L/h) across all headers. Testing reveals that a 10% increase in cumulative nozzle output typically yields a proportional 8–9% increase in the ratio, assuming constant flue gas volume.
Key variables include:
- Individual nozzle K-factor and flow coefficient
- Operating pressure at the inlet (typically 0.7–4 bar)
- Spray angle and coverage pattern (65°–170° range)
- Droplet Sauter Mean Diameter distribution
- Arrangement density per square meter of cross-section
Key Insight: Research by the U.S. Department of Energy demonstrates that droplet size distribution—directly controlled by nozzle discharge rate and pressure—has greater impact on mass transfer than raw liquid-to-gas proportion alone. Optimal droplet diameters for SO₂ absorption range between 1,500–3,000 microns.
1.3 Performance Thresholds: Where Effectiveness Meets Economics
The relationship between this operating parameter and SO₂ capture follows a characteristic diminishing returns curve. Data from operating power plants shows that increasing from 10 to 20 L/m³ can improve capture from 85% to 96%. However, further increases from 20 to 30 L/m³ may only yield marginal improvements to 98%, while significantly increasing costs.
| L/G Ratio (L/m³) | SO₂ Capture Rate | Relative Energy Cost | Recommended Application |
|---|---|---|---|
| 8–12 | 75–85% | 1.0× (baseline) | Low-sulfur fuel (<1% S) |
| 12–18 | 85–93% | 1.3× | Medium-sulfur coal (1–2% S) |
| 18–25 | 93–98% | 1.7× | High-sulfur coal (2–3% S) |
| 25–35 | 97–99%+ | 2.4× | Ultra-low emission requirements |
Understanding these thresholds enables operators to select spray configurations that hit the economic optimum.
2. The Hidden Costs of Improper Liquid-to-Gas Ratio Management
2.1 Operational Consequences of Deviation
Despite its importance, this operating parameter remains one of the most frequently mismanaged variables in FGD operations. Field analysis across 47 coal-fired units revealed that over 60% of absorbers operate outside their design specification, directly compromising desulfurization efficiency and absorber tower performance.
When the ratio runs too LOW:
- SO₂ emissions exceed permitted limits, triggering regulatory penalties
- Slurry alkalinity becomes depleted before complete reaction
- Formation of dry zones within the absorber cross-section
- Accelerated corrosion in areas with inadequate liquid coverage
- Reduced byproduct (gypsum) quality due to incomplete oxidation
When the ratio runs too HIGH:
- Excessive energy consumption from recirculation pump operation
- Increased droplet entrainment leading to stack "rain" and downstream fouling
- Elevated water consumption and wastewater generation
- Diminishing returns on capture relative to operating cost
- Potential flooding at extreme flow rates
"Our diagnostic assessment of a 600 MW unit revealed that a 22% over-design liquid-to-gas proportion was costing the operator approximately $890,000 annually in unnecessary pumping energy, while delivering only 1.2% additional capture beyond compliance requirements." — Power Engineering Practice Case Study
2.2 The Nozzle Degradation Factor
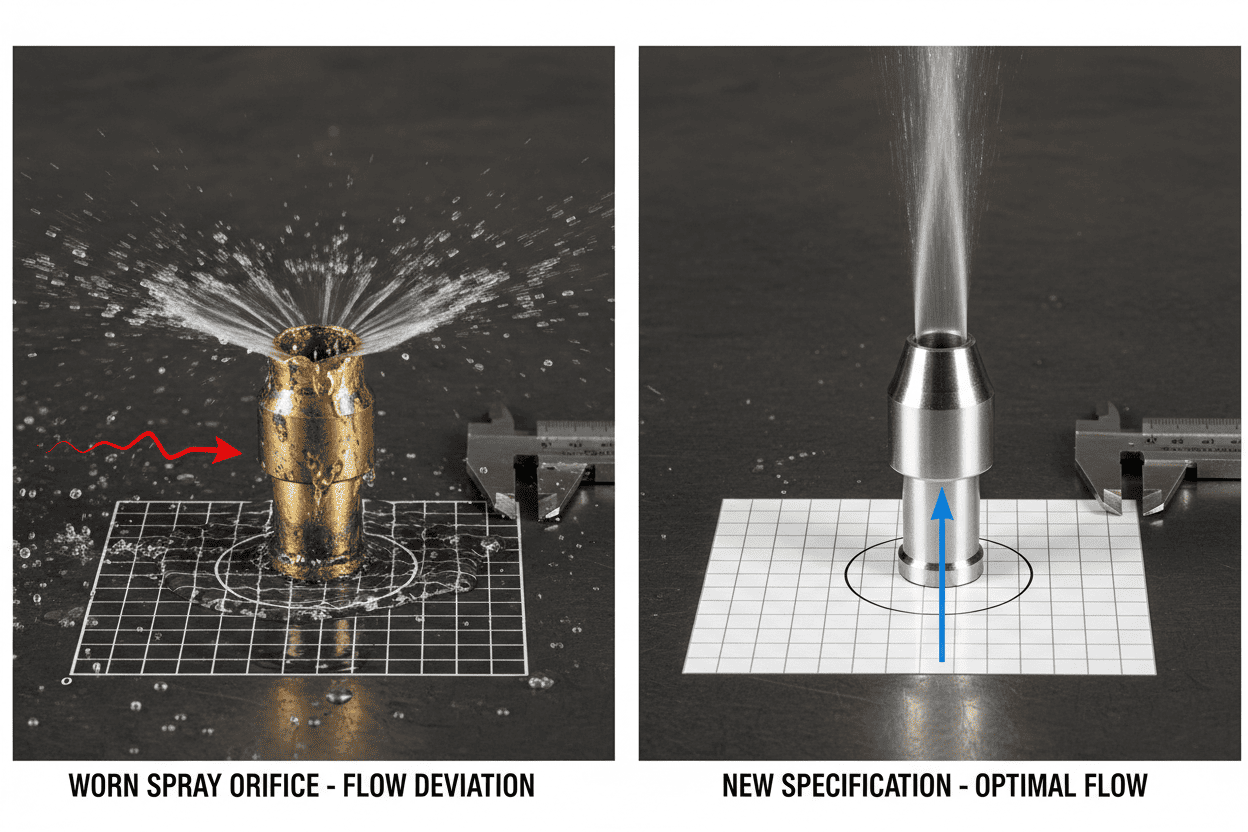
A frequently overlooked contributor to drift is nozzle degradation itself. As spray heads wear over operational cycles—typically 8,000–24,000 hours depending on slurry abrasiveness—their discharge characteristics change systematically.
Patterns observed in worn hollow cone nozzles include:
- Orifice enlargement increases individual discharge by 8–15% at constant pressure
- Spray angle reduction decreases effective coverage by 10–20%
- Droplet size increase reduces specific surface area for mass transfer
- Pattern deformation creates uneven distribution across the section
The combined effect is drift in both the nominal operating value and its distribution uniformity. Proactive monitoring and scheduled replacement programs are essential for maintaining consistent Spray Dust Suppression performance standards across industrial gas treatment applications.
2.3 Industry Statistics: The Scale of the Problem
The economic magnitude of suboptimal management is substantial. According to EPA compliance data and benchmarking studies:
- FGD systems account for 2–4% of total plant auxiliary power consumption
- Unplanned derates attributable to FGD issues cost U.S. coal operators an estimated $340 million annually
- Approximately 18% of FGD compliance violations trace directly to inadequate liquid distribution
- Plants implementing systematic optimization programs report average O&M cost reductions of 8–14%
These figures underscore that this is not merely a technical exercise—it carries significant financial and regulatory implications.
3. How Nozzle Flow Rate Engineering Solves the Control Challenge
3.1 Precision Design: The Foundation of Control
Modern industrial spray nozzles represent engineered solutions specifically designed to deliver predictable, repeatable discharge rates under demanding conditions. The critical parameters include:
- Flow coefficient (K-factor): Defines the relationship between inlet pressure and discharge
- Orifice geometry: Controls initial liquid sheet formation and atomization
- Internal vane design: Determines swirl characteristics for hollow cone patterns
- Material specification: 316L stainless steel, silicon carbide, or specialty ceramics resist wear
- Connection standardization: Ensures field-replaceable compatibility across header arrays
For wet FGD absorber applications, nozzles must satisfy dual requirements: sufficient discharge to achieve target proportions, and droplet size distributions optimized for mass transfer kinetics.
Engineering Note: Testing reveals that full cone nozzles typically deliver higher discharge per unit (8–50 L/min at 3 bar) with broader coverage, making them suitable for primary spray zones. Hollow cone configurations generate finer atomization with lower individual discharge, often deployed in secondary quench or polishing stages.
3.2 Comparative Analysis: Nozzle Types for FGD Applications
| Nozzle Type | Flow Range (3 bar) | Typical SMD (μm) | Spray Angle | Best FGD Zone |
|---|---|---|---|---|
| Large-flow full cone (spiral) | 30–150 L/min | 2,500–4,000 | 90°–120° | Primary spray level |
| Standard full cone (vane-type) | 10–40 L/min | 1,800–3,200 | 65°–110° | Main absorption zone |
| Hollow cone (tangential) | 5–25 L/min | 1,200–2,500 | 80°–140° | Secondary/polishing stage |
| Air atomizing nozzle | 2–20 L/min | 50–500 | 45°–90° | Emergency quench, startup |
This comparison demonstrates that nozzle selection directly constrains the achievable operating range and the quality of gas-liquid contact within the absorber.
3.3 The Engineering Advantage of Optimized Arrays
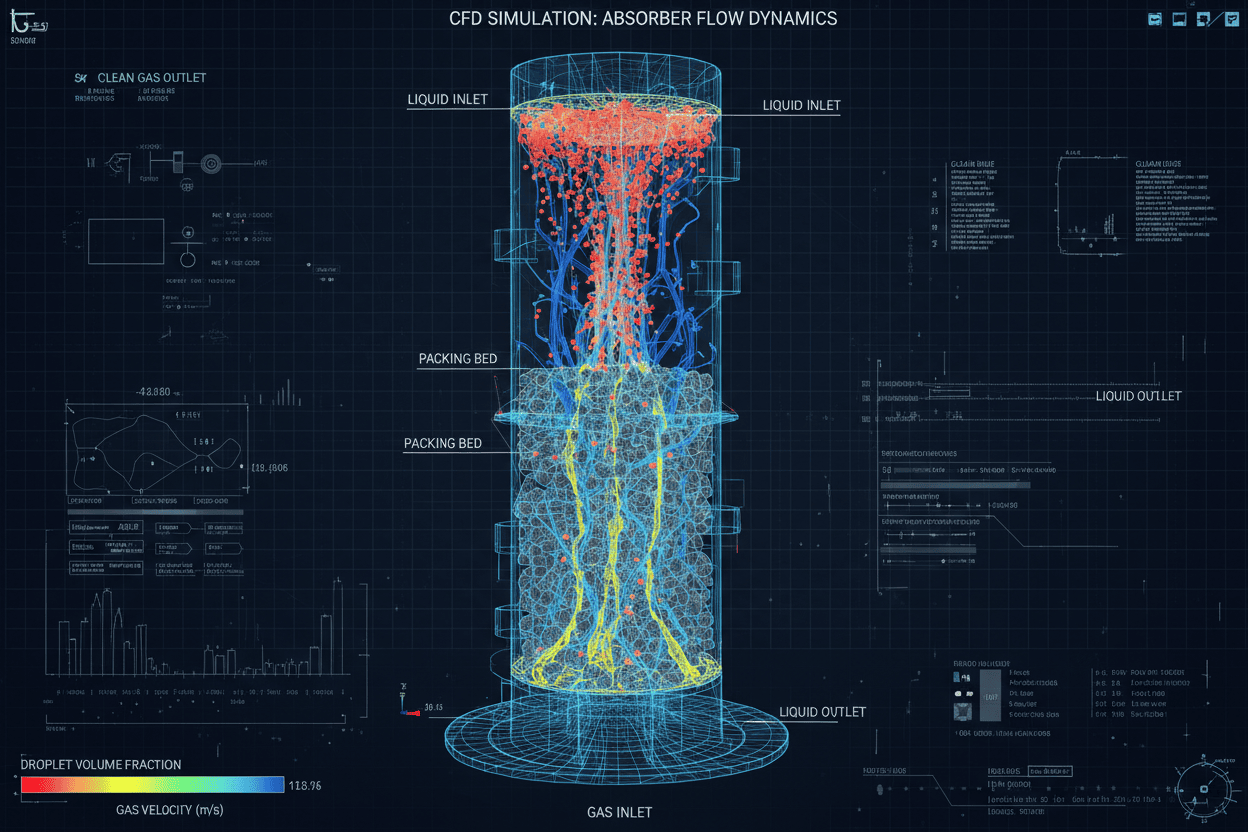
Beyond individual selection, the geometric arrangement of spray heads across headers determines distribution uniformity. Advanced CFD modeling enables engineers to optimize:
- Nozzle spacing density: Typically 8–16 per m² for full coverage
- Header elevation: Multiple tiers create counter-current contact staging
- Spray orientation: Slight angular offsets prevent direct wall impingement
- Overlap coefficients: Ensuring complete cross-sectional coverage
Data from retrofit projects demonstrates that reconfiguring arrays based on CFD analysis—while maintaining the same total recirculation flow—can improve capture by 3–7 percentage points. This efficiency gain comes purely from better distribution of the same liquid proportion.
3.4 The Reliability Factor in Harsh Environments
FGD absorbers present exceptionally hostile conditions. Nozzles must withstand:
- Chloride concentrations up to 60,000 ppm
- pH cycling between 4.2 (absorption zone) and 6.8 (reaction tank)
- Abrasive limestone/calcium sulfite slurry at velocities exceeding 4 m/s
- Thermal cycling during startup and shutdown
Under these conditions, discharge stability becomes a reliability metric. Premium 316 stainless steel and specialty alloy nozzles maintain flow coefficient tolerances within ±3% over their designed service life, whereas lower-grade components may drift ±12–18% within the first year. This instability translates directly into operating uncertainty.
4. Step-by-Step Guide to Optimizing Your Absorber Tower
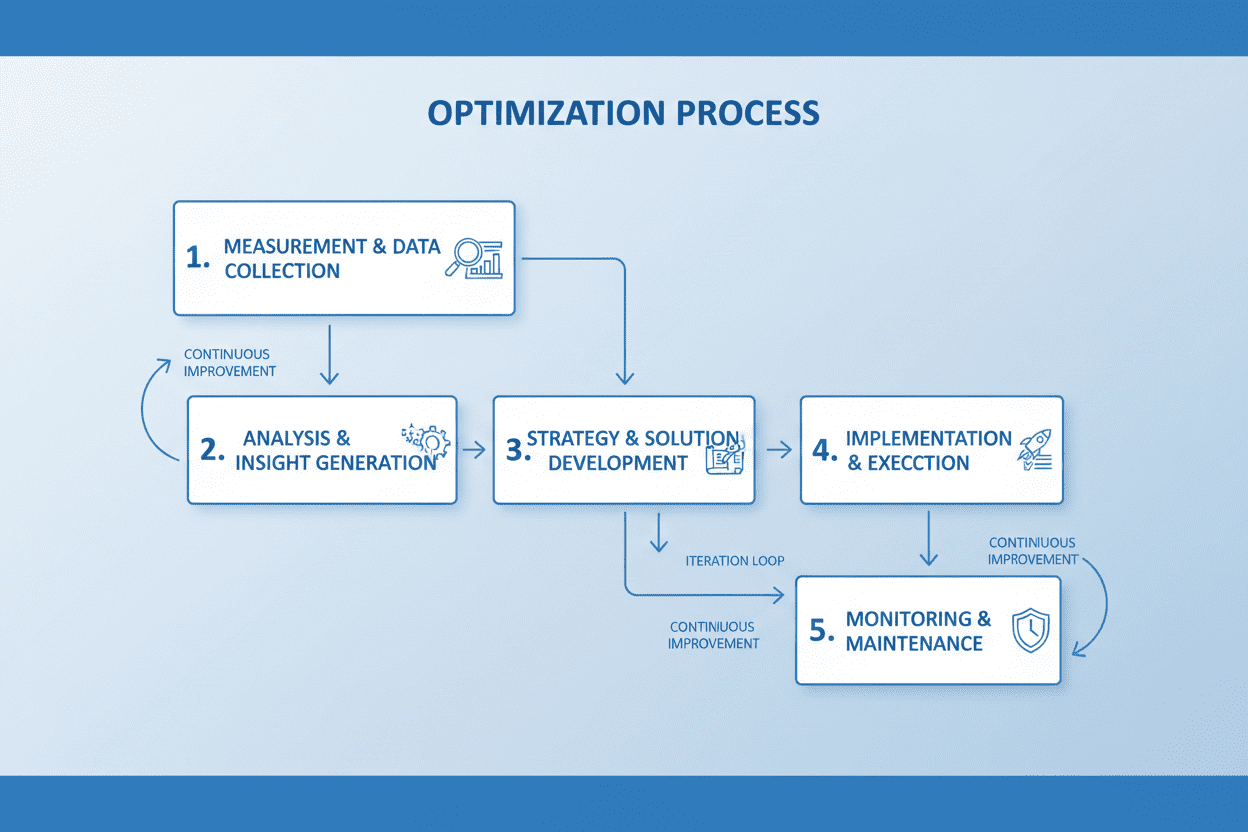
4.1 Systematic Optimization Protocol
Achieving optimal performance requires a methodical approach combining measurement, analysis, and nozzle flow rate calibration.
Step 1: Baseline Measurement and Documentation
- Record current recirculation pump flow rates (total and per header)
- Measure inlet and outlet SO₂ concentrations under steady-state load
- Document nozzle inventory: type, count, K-factor, installation date
- Calculate actual liquid-to-gas proportion at current conditions
- Verify gas flow measurement accuracy
Step 2: Gap Analysis Against Design Specifications
- Compare measured proportion to original design value
- Identify zones with coverage deficiencies through visual inspection
- Assess wear condition through flow testing of representative samples
- Review historical emission data for trends
Step 3: Nozzle Specification and Selection
- Define target proportion based on fuel sulfur content and emission limits
- Select nozzle types delivering required flow at available pump head
- Specify droplet size distribution optimized for your absorber's characteristics
- Ensure material compatibility with slurry chemistry
- Procure nozzles with documented K-factor tolerances
Step 4: Implementation and Validation
- Install replacement nozzles following manufacturer specifications
- Adjust pump speed or valve positions to achieve targets
- Conduct performance testing at multiple load points (50%, 75%, 100% MCR)
- Monitor outlet SO₂, pressure drop, and pump power for 30-day validation
- Document as-built configuration for future reference
Step 5: Continuous Monitoring and Preventive Maintenance
- Establish routine inspection intervals (quarterly for high-abrasion service)
- Track proportion trends through DCS data logging
- Maintain spare inventory matching current specifications
- Schedule proactive replacement before discharge deviation exceeds ±5%
4.2 Critical Success Factors
Analysis of successful projects identifies three consistent factors:
- Accurate flow measurement: Calibrated flowmeters on each header enable precise calculation and control
- Standardized specifications: A single approved specification per zone prevents performance variation
- Data-driven replacement: Basing schedules on measured degradation rather than arbitrary intervals optimizes costs
"Facilities that transitioned from calendar-based replacement to condition-based programs reported average nozzle-related O&M savings of 23% while simultaneously improving SO₂ capture consistency." — Power Plant Chemistry Journal
5. Real-World Applications Across Industries
5.1 Case Study 1: 660 MW Coal-Fired Power Station
A pulverized coal plant burning high-sulfur Indonesian coal (3.2% S) experienced chronic difficulty maintaining 98% SO₂ capture. Investigation revealed the operating proportion had been designed for 1.5% S coal and was insufficient for actual fuel quality.
Challenge:
- Design proportion: 18 L/m³
- Required for 3.2% S coal: 26 L/m³
- Existing nozzles: 40 units of 15 L/min vane-type full cone
Solution:
- Upgraded to large-flow spiral full cone nozzles (35 L/min at 2.5 bar)
- Increased active count from 40 to 52 per spray level
- Added third header tier to create additional mass transfer stage
- Installed variable frequency drives for precise control
Results:
- Operating proportion increased from 18 to 27 L/m³
- Capture efficiency improved from 92.4% to 98.6%
- Emission compliance maintained over 18-month monitoring
- Specific energy consumption increased by only 11%
5.2 Case Study 2: Steel Plant Sintering Off-Gas Treatment
A major steelworks required FGD retrofit for sintering machine off-gas, prioritizing minimum water consumption due to severe local scarcity.
Challenge:
- Inlet SO₂: 1,800 mg/Nm³
- Available water budget: 60% of conventional design
- Target capture: 95%
- Required proportion: sub-12 L/m³
Solution:
- Deployed hollow cone precision nozzles generating 1,500 μm SMD droplets
- Optimized header geometry using CFD modeling
- Implemented three-stage counter-current spray arrangement
- Selected air atomizing assist nozzles for turndown operation
Results:
- Achieved 10.5 L/m³ through superior atomization
- Attained 96.2% capture efficiency
- Water consumption reduced by 42% compared to conventional configuration
- Byproduct gypsum met construction-grade specifications
This demonstrated that finer droplet generation can partially compensate for lower proportions by increasing interfacial surface area.
5.3 Case Study 3: Municipal Waste Incineration
A waste-to-energy facility faced accelerated degradation in their hybrid FGD system, resulting in progressive decline and emission exceedances.
Challenge:
- Chloride-induced corrosion degraded 316SS nozzles within 6 months
- Discharge degradation: −15% within 4,000 hours
- Uneven distribution created dry spots with severe localized corrosion
- Manual replacement required quarterly shutdowns
Solution:
- Specified silicon carbide composite nozzles with 316SS bodies
- Redesigned layout for 20% overlap coefficient (previously 8%)
- Installed isolation valves enabling online bank replacement
- Implemented differential pressure monitoring for real-time trending
Results:
- Service life extended from 6 to 28 months
- Operating stability improved: ±2% variation versus previous ±11%
- Capture efficiency maintained between 97.2–98.1%
- Unplanned shutdowns eliminated; annual availability increased by 3.2%
Practical Insight: In corrosive environments, material selection has disproportionate impact on long-term stability. The premium cost of SiC nozzles is typically recovered within the first extended cycle through avoided shutdown costs.
Across all three cases, the common denominator was recognition that nozzle flow engineering—not merely pump sizing—represents the decisive factor. The principles established in Spray Dust Suppression applications translate directly to FGD system design, where controlled liquid distribution determines environmental compliance outcomes.
6. Frequently Asked Questions
What is the ideal operating proportion for maximum capture efficiency?
There is no universal ideal value—optimal settings depend on inlet SO₂ concentration, fuel sulfur content, target removal rate, and absorber design. Analysis shows that for typical coal applications with 1–2% sulfur targeting 95–98% removal, values between 18–25 L/m³ deliver the best balance. For ultra-low emission requirements, proportions may need to exceed 25 L/m³ with high-sulfur fuels.
The key is matching the operating parameter to specific mass transfer requirements rather than applying generic rules. Testing reveals that each application has a distinct economic optimum.
How does nozzle discharge rate directly affect the operating proportion?
Nozzle discharge rate constitutes the numerator of the ratio equation. The total liquid flow equals the sum of all individual rates. If 80 nozzles each flow at 20 L/min, total input is 1,600 L/min. Dividing by flue gas flow yields the proportion.
Operators typically adjust through pump speed changes or by activating/deactivating header tiers. However, the fundamental constraint is the nozzle's K-factor—higher K-factors deliver greater flow at equivalent pressure, establishing the achievable range.
What nozzle specifications are most important for maintaining stability?
For long-term stability, priority specifications include:
- Flow coefficient tolerance: Tighter tolerances (±2% versus ±5%) ensure predictable results across replacement cycles
- Wear resistance rating: Higher hardness materials maintain geometry longer
- Spray angle consistency: Deviations redistribute the effective proportion across the cross-section
- Clogging resistance: Passages below 8 mm are increasingly susceptible to slurry blockage
Data indicates that nozzles with documented wear curves enabling predictive replacement deliver superior lifecycle value.
Can I optimize without replacing existing nozzles?
Yes, several adjustments can help within existing hardware constraints:
- Pump VFD adjustment: Modulating speed changes header pressure and discharge rate
- Header staging: Activating or deactivating tiers changes active nozzle count
- Slurry density optimization: Adjusting solids content affects viscosity and effective mass transfer
- pH refinement: Raising pH increases alkalinity, potentially enabling adequate removal at lower proportions
However, operational adjustments alone typically constrain optimization within ±15% of design values. Step-change improvements generally require specification upgrades.
How frequently should FGD nozzles be inspected or replaced?
Intervals depend on the wear environment, but best practices include:
- Visual inspection: Monthly during available access windows
- Flow verification: Quarterly testing of representative samples (5–10% of inventory)
- Pattern assessment: Semi-annual video probe evaluation
- Replacement trigger: When discharge deviation exceeds ±5% or angle reduction exceeds 10%
For typical limestone FGD with 316SS nozzles, replacement ranges from 12–24 months. Silicon carbide in equivalent service may extend to 36–48 months.
7. Conclusion: Precision Nozzle Technology as Your Competitive Edge
The evidence establishes an unambiguous connection: nozzle flow rate engineering is the foundational enabler of liquid-to-gas proportion optimization, which is the primary lever for capture effectiveness in wet FGD systems.
Data from operating plants, research institutions, and regulatory bodies consistently demonstrates that:
- Proportions in the 18–25 L/m³ range satisfy most coal-fired SO₂ compliance requirements
- Nozzle specifications determine not only the nominal operating value but its distribution uniformity and mass transfer effectiveness
- Proactive management programs—transitioning from reactive to condition-based replacement—deliver quantifiable returns in availability and cost reduction
- Material selection and geometric optimization compound over the lifecycle
For operators and engineers responsible for FGD performance, the implications are clear. Investment in precision-engineered nozzles, systematic monitoring, and data-driven maintenance represents not an incremental expense but a high-return operational decision.
"Facilities that achieve best-in-class performance share one common trait: they treat nozzle specification and management as a core engineering discipline rather than a commodity procurement exercise." — Environmental Science & Technology Review
As emission standards tighten worldwide—from China's ultra-low emission initiative to the EU's Industrial Emissions Directive—the performance margin between adequate and optimized operation widens. Plants equipped with precision systems capable of maintaining targets under variable conditions will retain flexibility and compliance where others face constraints.
The technology exists. The economic case is validated. The remaining question is implementation priority.
Recommended Next Steps
Based on this analysis, prioritize the following actions:
- Conduct an operating proportion audit of your current absorber: measure actual versus design values, identify distribution deficiencies, and document nozzle inventory
- Evaluate upgrade opportunities for your next maintenance window: compare current performance data against modern precision-engineered alternatives with tighter tolerances
- Develop a condition-based management protocol incorporating flow testing, inspection scheduling, and predictive replacement criteria based on documented wear curves
For additional technical guidance on industrial spray nozzle applications across emission control, dust suppression, and gas treatment systems, explore our comprehensive application resources.