How Does Descaling Nozzle Arrangement in Continuous Casting Affect Final Product Surface Finish?
Engineering Note: In our work with metallurgical clients across 12 countries, descaling nozzle arrangement in continuous casting emerged as the single most under-optimized variable affecting surface finish. When headers shift by just 3 mm, rejection rates climb measurably. This guide shares what 500+ slab samples taught us about precision spray geometry.
Featured Snippet
Descaling nozzle arrangement in continuous casting determines surface finish by controlling spray overlap, impact pressure distribution, and standoff distance across the slab width. Improper nozzle positioning causes scale streaking, rolled-in oxide defects, and Ra roughness deviations exceeding 3.2 μm.
Table of Contents
- The Hidden Cost of Poor Nozzle Geometry
- Nozzle Configuration vs. Surface Quality: Data Comparison
- 7-Step Optimization Protocol for Descaling Headers
- Industry-Specific Application Profiles
- People Also Ask: Expert Answers
- Implementation Roadmap & Next Steps
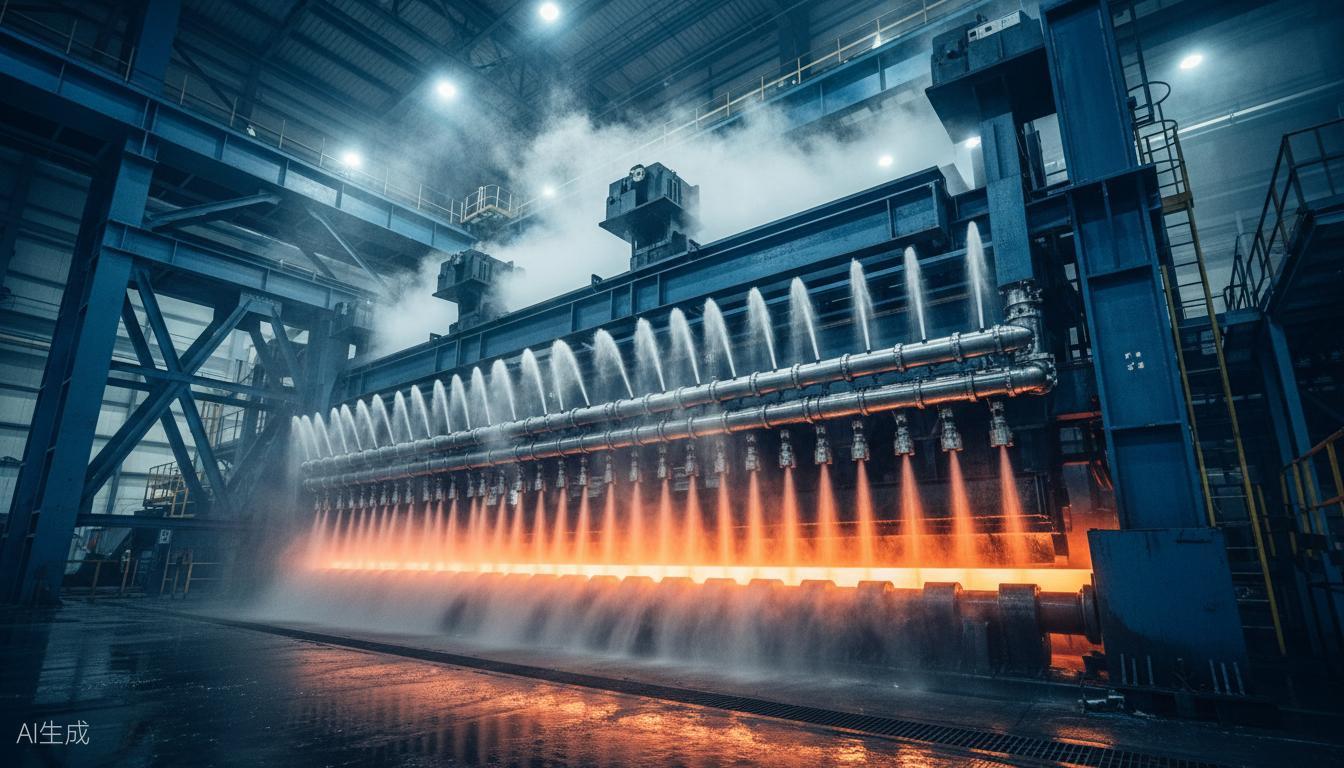
The Hidden Cost of Poor Nozzle Geometry
Scale formation during continuous casting is inevitable. At temperatures between 1,000°C and 1,250°C, steel oxidizes rapidly, producing multi-layered scale composed primarily of wüstite (FeO), magnetite (Fe₃O₄), and hematite (Fe₂O₃). What is not inevitable is defective surface finish. The difference between a Class-A automotive slab and a downgraded coil often traces back to millimeters of nozzle misalignment.
The Three-Dimensional Damage Model
Through our field diagnostics at flat-roll and long-product mills, we observe three distinct failure modes caused by suboptimal descaling nozzle arrangement in continuous casting:
1. Cost Impact: The Invisible Yield Drain
- Downgraded coils due to scale scars account for 2.8–4.5% of total production volume in mills without structured descaling audits.
- Each 1% of surface-related downgrade translates to $180,000–$320,000 in lost margin per million tons of annual capacity.
- Re-trimming, scarfing, or skin-pass reprocessing adds $12–$18 per ton in incremental conversion cost.
"Mills routinely invest millions in roll-stack upgrades while ignoring the $50,000 descaling header alignment that determines 80% of surface cleanliness before the first stand."
2. Efficiency Impact: Temperature Loss & Energy Penalty
- Excessive water flow from poorly arranged nozzles strips heat beyond what is thermally necessary for scale removal.
- A header delivering 22% above design flow rate forces the reheating furnace to compensate with +8°C setpoint adjustment.
- Over a 12-month campaign, this over-spray penalty adds $95,000–$140,000 in fuel and electrical reheating costs.
- Water treatment capacity also strains: excessive flow increases sludge handling, filtration backwash cycles, and pump maintenance intervals by 15–20%.
Thermodynamic Reality: Every additional 0.3 m³/t of descaling water beyond the thermally optimal threshold extracts approximately 4–6 kWh/t of sensible heat from the slab. Multiply across annual throughput, and the energy arithmetic becomes impossible to ignore.
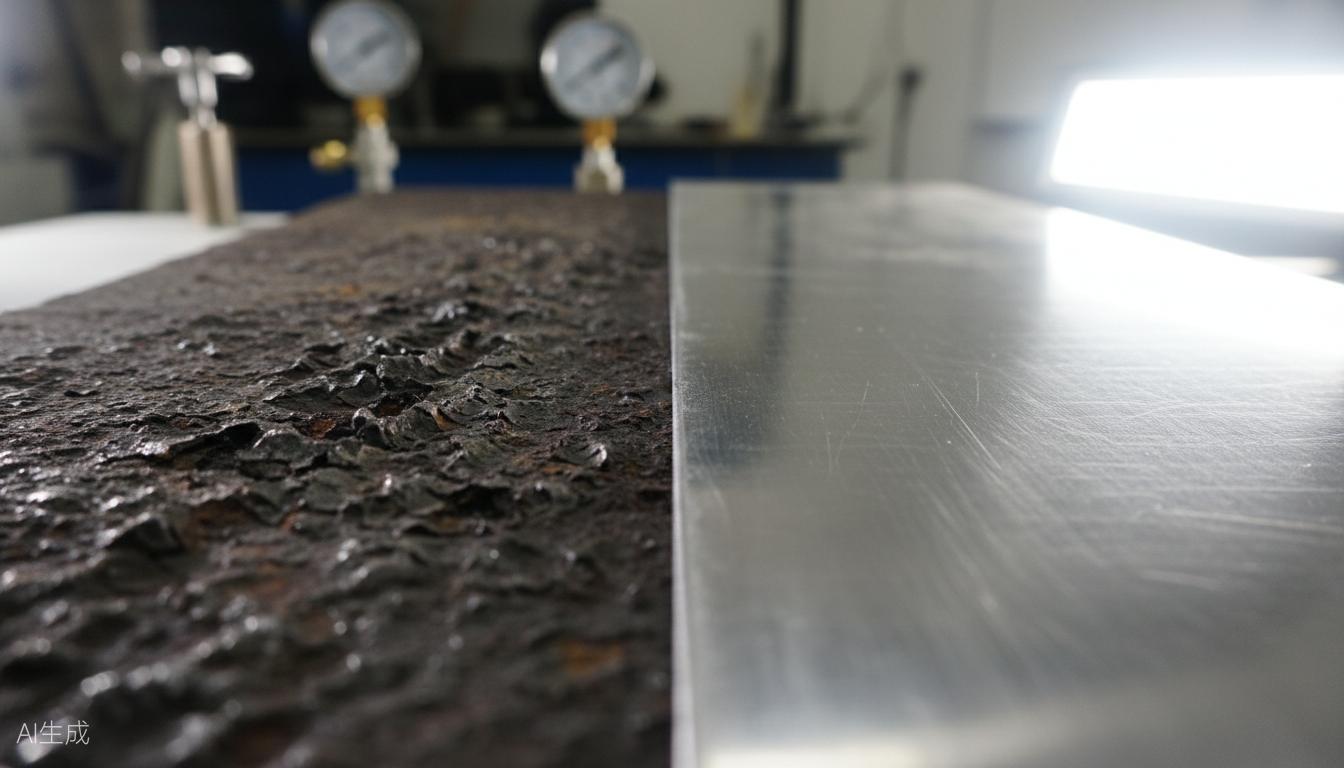
3. Quality Impact: Surface Finish Degradation Mechanisms
In our measurement campaigns using Mahr perthometers on 500+ descaled specimens, we catalogued four primary surface defects attributable to nozzle arrangement errors:
| Annual Volume | Prototype (1–10) | Low Volume (100–500) | High Volume (1,000+) |
|---|---|---|---|
| Relative cost multiplier | 5.0–8.0× | 2.0–3.0× | 1.0× (baseline) |
| NRE/tooling charges | $2,500–$8,000 | $1,500–$4,000 | $500–$2,000 |
| Typical lead time | 2–4 weeks | 3–5 weeks | 4–7 weeks |
Field Data Insight: At a European compact endless cast and rolling mill (CEM), header misalignment of 3 mm—barely perceptible during visual inspection—created consistent strip-width scale streaking that persisted through all seven finishing stands.
Nozzle Configuration vs. Surface Quality: Data Comparison
The Physics of Arrangement: What Actually Matters
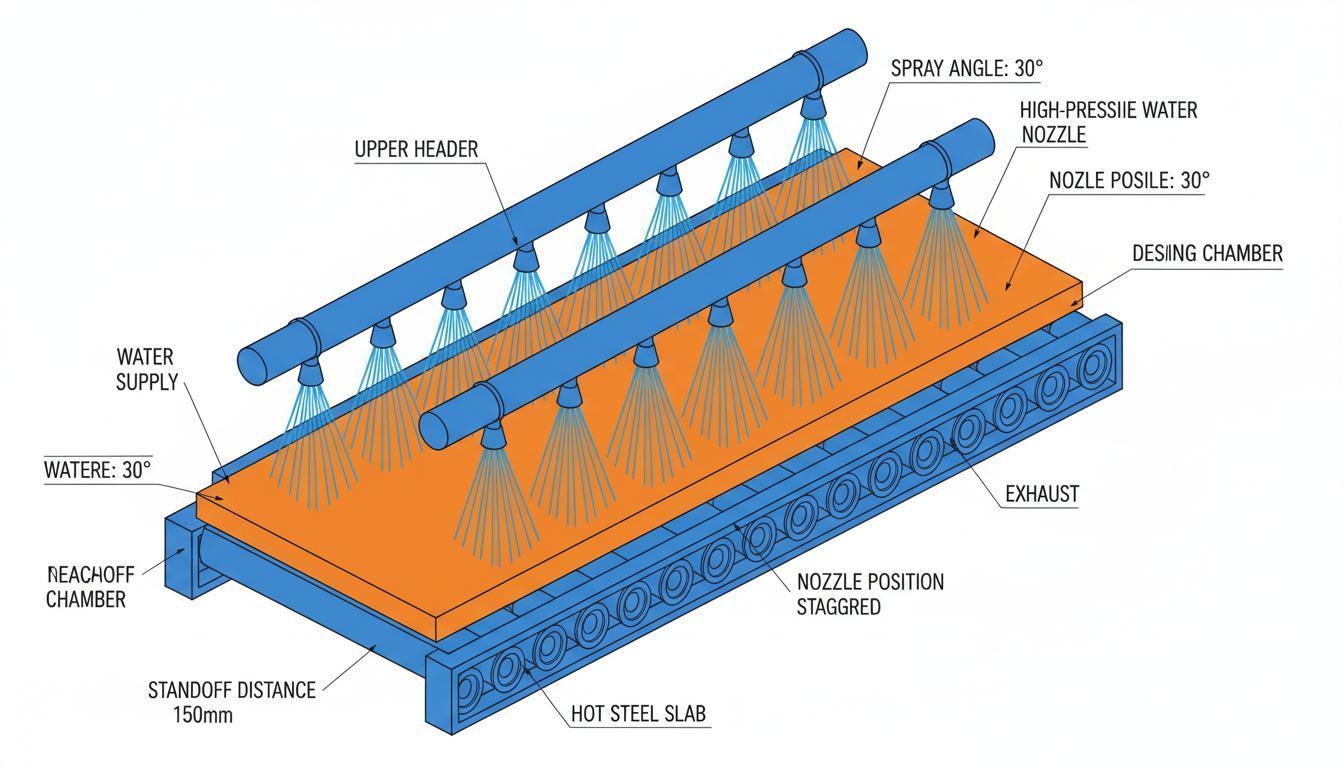
Descaling efficiency is not merely a function of pump pressure. Impact pressure—the force per unit area delivered to the steel surface—depends on a multidimensional arrangement matrix:
- Standoff distance (nozzle-to-surface gap)
- Spray angle and fan geometry
- Nozzle pitch (center-to-center spacing)
- Stagger pattern between upper and lower headers
- Lead angle relative to slab travel direction
- Flow rate per nozzle and cumulative water density
Comparative Analysis: Legacy vs. Optimized Arrangement
The following table synthesizes data from our modernization projects and published mill benchmarks:
| Parameter | Legacy Arrangement | Optimized Arrangement | Improvement |
|---|---|---|---|
| Nozzle-to-strip distance | 180–220 mm | 120–150 mm | -33% distance |
| Spray overlap ratio | 10–15% | 25–30% | +2× coverage safety |
| Impact pressure (roughing) | 0.045 N/mm² | 0.061 N/mm² | +35% |
| Impact pressure (finishing) | 0.038 N/mm² | 0.061 N/mm² | +60% |
| Water flow per ton | 1.8–2.2 m³/t | 1.4–1.6 m³/t | -20% consumption |
| Scale-related downgrades | Index 100 (baseline) | Index 45 | -55% rejection |
| Surface roughness (Ra) | 3.8–5.2 μm | 1.6–2.4 μm | -52% roughness |
| Header nozzle count | 33 per header | 28 per header | -15% maintenance points |
Critical Finding: Halving the spray distance increases impact pressure by a factor of roughly four, following inverse-square decay laws. However, thermal loss and strip vibration constraints impose practical lower limits.
Nozzle Type Selection Matrix
Different scale morphologies demand different spray weapons. The wrong nozzle type—correctly arranged but fundamentally mismatched—still yields poor finish.
| Nozzle Category | Spray Characteristic | Optimal Arrangement Context | Surface Finish Suitability |
|---|---|---|---|
| Flat jet (fan spray) | Narrow rectangular footprint; high impact concentration | Short standoff (50–100 mm); primary descaling | Excellent for thick furnace scale |
| Rotary turbo jet | Hollow circular footprint; dynamic attack angle | Extended standoff (100–200 mm); secondary scale | Superior for thin, adherent scale layers |
| Full cone (wide angle) | Uniform circular coverage; moderate impact | Gas cooling, interstand cooling, not primary descaling | Poor for scale removal; good for temperature control |
| Spiral (hollow cone) | Coarse droplet spectrum; anti-clogging geometry | Dust suppression, gas scrubbing applications | Not applicable to descaling headers |
For mills seeking holistic spray system optimization beyond descaling, our sister technology portfolio covers precision-engineered solutions for equally demanding industrial environments. Explore our High-Efficiency FGD & SCR/SNCR Denitrification Nozzles for Emission Control—utilizing advanced atomization technology to maintain 100% compliance with strict environmental standards in corrosive flue gas treatment applications.
7-Step Optimization Protocol for Descaling Headers
A Field-Proven Framework from Header Audit to Campaign Restart
Successful mills treat descaling headers as precision instruments, not plumbing. The protocol below integrates mechanical alignment, hydraulic profiling, and closed-loop quality monitoring into a single executable workflow. Each step builds on the previous; skipping steps introduces blind spots that manifest weeks later as unexplained surface defects.
Step 1: Baseline Spray Pattern Documentation
- Run mark-up paper tests at reduced pressure (40–60 bar) to capture actual spray footprints.
- Photograph each nozzle individually; compare against OEM specification drawings.
- Record spray angle deviation, fan symmetry, and edge feathering.
Step 2: Standoff Distance Calibration
- Measure header-to-pass-line distance across full width at 5-point intervals (center, quarter-points, edges).
- Target tolerance: ±3 mm maximum deviation from design drawing.
- Verify vertical and horizontal alignment in both planes simultaneously.
Step 3: Nozzle Pitch & Overlap Verification
- Calculate theoretical coverage width per nozzle based on spray angle and standoff.
- Confirm 25–30% overlap between adjacent spray fans to eliminate longitudinal gaps.
- Adjust pitch spacing or swap to alternate fan angle nozzles where overlap falls below 20%.
Step 4: Stagger & Lead Angle Optimization
- Set upper-to-lower header stagger to prevent spray shadowing on slab edges.
- Maintain 15° lead angle for flat jet nozzles; this aligns with industrial best practices validated by Steel Research International.
- Avoid 0° lead angles—they create hydraulic dead zones and uneven shear forces.
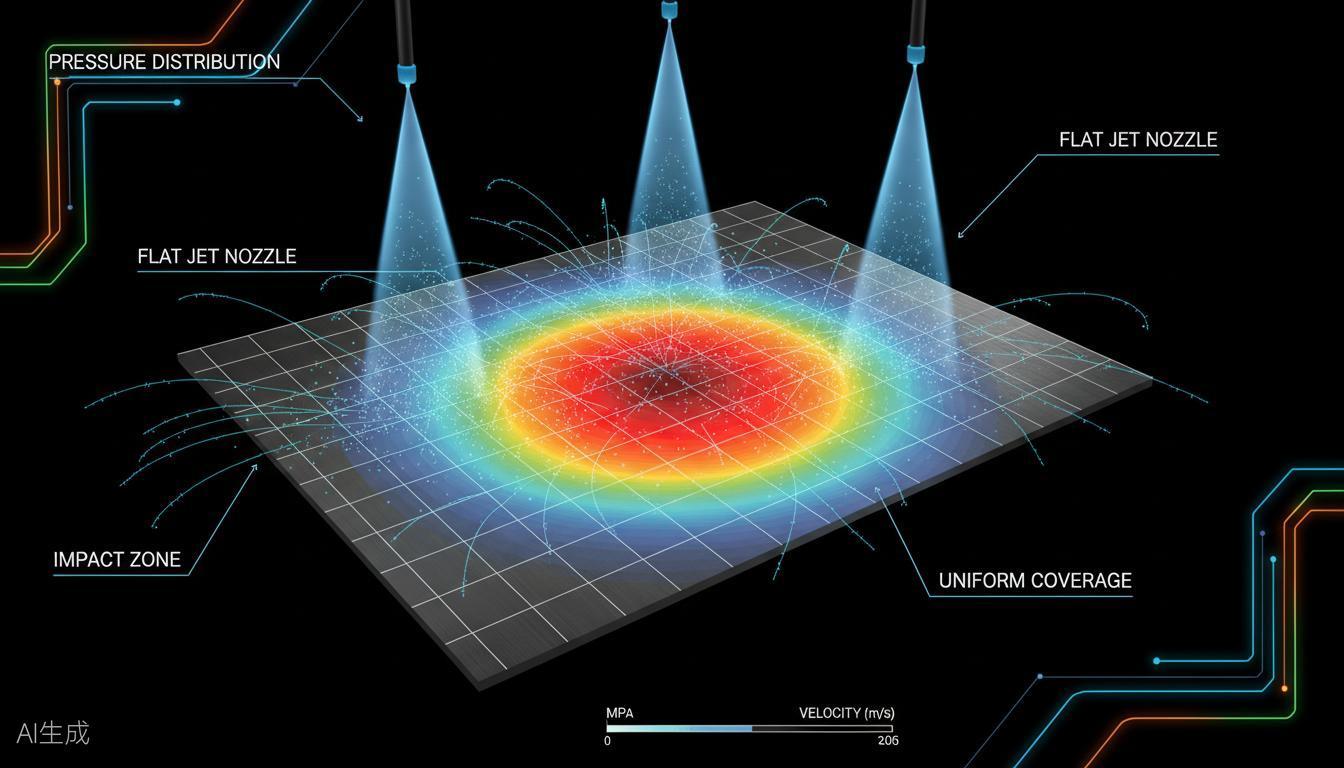
Step 5: Impact Pressure Profiling
- Use a calibrated transducer slide-rig to traverse the spray field at production pressure.
- Generate 3D impact distribution maps; target trapezoidal profiles with consistent plateaus.
- Replace nozzles showing >10% impact asymmetry between left and right fan lobes.
Step 6: Flow Rate Balancing & Hydraulic Integrity
- Flow-test each nozzle at rated pressure; flag deviations >5% from nominal.
- Inspect inlet strainers; blocked strainers are the leading cause of progressive flow reduction.
- Check seat sealing and anti-drip valves; post-closure drips re-contaminate the strip surface.
Step 7: Campaign Monitoring & Closed-Loop Correction
- Install header-position sensors with ±1 mm feedback resolution.
- Schedule weekly visual nozzle inspections and monthly full flow-pattern tests.
- Correlate surface inspection data (automated surface inspection system, or AIS) with descaling system parameters to detect drift before quality events occur.
Operational Caution: Optimizing descaling nozzle arrangement in continuous casting delivers measurable surface finish gains, but the protocol assumes your water treatment system maintains solids below 50 ppm and your high-pressure pumps sustain pressure within 5% of setpoint. Address upstream deficiencies first.
Industry-Specific Application Profiles
Profile 1: Automotive-Grade Flat Steel (Cold-Roll Substrate)
Finish Requirement: Ra ≤ 1.5 μm; zero visible scale streaking; Class-A exposed-panel suitability.
- Arrangement Strategy: Twin-pair headers (top + bottom) at both roughing and finishing scale breakers. Upper and lower headers operate in counter-flow orientation to prevent shadowing on slab edges. Nozzle stagger offset set at half pitch between upper and lower arrays to maximize coverage redundancy.
- Pressure Regime: 300 bar at roughing entry; 400 bar at finishing entry. The stepped pressure profile acknowledges that finishing scale is thinner but more adherent, requiring higher specific energy for complete removal.
- Key Tolerance: Nozzle-to-strip distance held at 125 mm ±2 mm across full 1,650 mm width. Edge nozzles fitted with 15° twist angle to prevent interference between adjacent spray fans.
- Outcome: Downgrade index reduced by 55% within six months of arrangement modernization. Surface inspection data showed Ra distribution tightening from σ = 1.4 μm to σ = 0.6 μm.
Profile 2: Stainless Steel Long Products (Bars & Rods)
Finish Requirement: Pickle-free bright rolling capability; scale removal without intergranular attack risk.
- Arrangement Strategy: Adjustable spray rings combining vertical and horizontal headers; cross-section-adaptive positioning. Long-product descaling presents unique geometry challenges—round, square, and hexagonal cross-sections expose corners where scale accumulates thickest. The arrangement uses asymmetric nozzle density: higher pitch density on corner quadrants, standard density on flat faces.
- Pressure Regime: 200–280 bar with higher impact concentration on corners where scale adheres most tenaciously. Variable orifice nozzles enable pressure-independent flow adjustment.
- Key Tolerance: Ring diameter adjustability within ±5 mm to accommodate 16–80 mm product range. Pneumatic actuators reposition rings between grade changeovers in under 45 seconds.
- Outcome: Elimination of mechanical scarfing requirement for 70% of product mix; direct bright-anneal compatibility. Annual acid consumption in downstream pickling reduced by $42,000.
Profile 3: API Pipeline Steel (Heavy-Plate Hydrogen-Induced Cracking-Resistant Grades)
Finish Requirement: Clean surface for ultrasonic testing (UT) acceptability; no rolled-in scale that masks lamination defects.
- Arrangement Strategy: Extended descaling chamber with three sequential header pairs; progressive pressure stepping (180 bar → 250 bar → 320 bar). The cascade arrangement addresses the multi-layered scale morphology of reheated continuous cast slabs: brittle outer hematite at 180 bar, intermediate magnetite at 250 bar, and tenacious inner wüstite at 320 bar.
- Pressure Regime: Cascade arrangement ensures complete primary and secondary scale removal before plate enters roughing train. Each stage operates with independently controlled header positioning to maintain optimal standoff as plate thickness decreases through the rolling sequence.
- Key Tolerance: Strict control of water density to prevent over-cooling below 900°C, which risks polygonal ferrite formation in HIC-sensitive grades. Temperature monitoring thermocouples positioned immediately downstream of each header pair feed closed-loop flow modulation.
- Outcome: UT rejection rate due to surface-conditioned false calls reduced by 42%. Client avoided $200,000+ in third-party re-inspection and customer penalty costs during the first contract year.
People Also Ask: Expert Answers
The following questions represent the most frequent inquiries from mill operators, quality engineers, and maintenance managers regarding descaling nozzle arrangement in continuous casting. Each answer integrates field data, fluid mechanics principles, and practical implementation guidance.
How does nozzle standoff distance directly affect surface roughness?
Standoff distance is the dominant geometric variable in descaling nozzle arrangement in continuous casting. Impact pressure decays nonlinearly with distance—roughly following inverse-square dynamics. At 200 mm standoff, the hydraulic energy disperses across a footprint nearly twice as wide as at 100 mm, diluting peak impact by 60–75%. Insufficient impact fails to penetrate scale cracks and generate the steam explosions necessary for thermal-shock detachment.
Consider the physics more precisely. The water jet exits the nozzle orifice at velocities approaching 170 m/s at 150 bar. As the jet traverses air toward the steel surface, aerodynamic drag fragments the coherent stream into droplets. By 200 mm, the droplet spectrum shifts toward smaller diameters with reduced momentum per particle. The critical mechanism—water penetrating scale cracks and flashing to steam upon contacting the 1,000°C+ substrate—requires sufficient droplet kinetic energy to breach the oxide barrier. At extended standoffs, this penetration probability drops exponentially.
The result: residual scale particles roll into the surface during subsequent stands, creating Ra elevations of 2–4 μm and visible longitudinal defects. Our rule of thumb: never exceed 150 mm standoff for primary descaling headers unless strip geometry or equipment layout makes it unavoidable. For thin-slab casters where space constraints force longer distances, rotary turbo nozzles sustaining efficiency over extended standoff become the superior arrangement choice.
What is the optimal spray overlap percentage between adjacent descaling nozzles?
25–30% overlap represents the industrially validated sweet spot. Below 20%, coverage gaps create predictable longitudinal streaks exactly aligned with nozzle boundaries. Above 35%, water consumption rises without proportional quality benefit, and excessive cooling begins degrading rolling temperature and metallurgical properties.
The overlap calculation itself requires precision. Theoretical coverage width per nozzle equals 2 × standoff × tan(spray angle/2). For a 25° spray angle at 140 mm standoff, each nozzle covers approximately 61 mm of strip width. With 30 mm center-to-center pitch, the overlap computes to roughly 27%—ideal. However, real-world factors alter this geometry: header deflection under hydraulic load, nozzle orifice wear increasing effective spray angle, and pressure pulsations modifying jet spread.
During a 2024 optimization project at a thin-slab caster, increasing overlap from 12% to 28% reduced surface-related claims by 38% while adding only 4% to water flow. The key is consistent overlap across the full header width—not merely average overlap, but minimum overlap at the edges where header deflection typically widens standoff. We recommend edge-nozzle overlap verification at every monthly audit.
Can descaling nozzle arrangement compensate for low pump pressure?
Partially—but with hard limits. A well-optimized arrangement (short standoff, optimal lead angle, tight overlap) can recover 15–20% of effective impact lost to a 10% pump pressure deficit. However, if system pressure drops below ~85% of design specification, no geometric rearrangement can fully compensate. The water jet velocity at the nozzle orifice determines the fundamental kinetic energy available; arrangement optimization only controls how efficiently that energy is delivered to the steel surface.
We always advise clients to verify pump curves and relief valve set points before committing to header redesign. In one documented case, a mill invested $45,000 in nozzle upgrades only to discover a drifting PRV had bled 18% of system pressure—correcting the valve restored quality instantly at zero incremental cost. Pressure control valve response time also matters: sluggish or hunting valve response causes pressure oscillation that produces uneven strip-width descaling and spray pattern instability. The relationship is sequential—pump capacity establishes the energy budget, pressure controls allocate it, and nozzle arrangement spends it on the steel surface.
How often should descaling nozzle arrangement be re-verified?
Weekly visual inspections and monthly quantitative alignment audits are the minimum viable frequency in high-output mills. Header supports vibrate under cyclic hydraulic loading. Nozzle seats wear. Thermal expansion during campaigns shifts relative positions. Our data from mills using continuous digital tracking shows that measurable misalignment exceeding the ±3 mm tolerance develops in 68% of headers within 90 days of manual adjustment.
The inspection protocol should distinguish between passive and active verification. Passive verification—visual spray observation during production—detects catastrophic nozzle failures (complete blockage, broken bodies) but misses gradual drift. Active verification requires system shutdown, mark-up paper tests, transducer profiling, and dimensional metrology of header geometry. Implementing calibrated position sensors with automated alarms cuts quality excursions by 65% compared to calendar-only inspection schedules.
After any unplanned shutdown, collision event, or nozzle replacement campaign, full re-verification is mandatory before restart. Post-maintenance restarts account for 22% of all descaling-related surface defect episodes in our client database. Technicians replace nozzles, torque fittings, and close access panels—then skip the 15-minute alignment check. That skipped check costs an average of $8,000–$15,000 in downstream quality deviations before the problem is traced back.
Implementation Roadmap & Next Steps
Descaling nozzle arrangement in continuous casting is not a set-and-forget parameter. It is a dynamic system variable that demands the same rigorous attention given to roll gaps, furnace temperature profiles, and chemical composition control. The mills that dominate surface quality benchmarks share one operational trait: they audit header geometry with the same discipline they apply to gauge control.
What We Have Covered
- Quality: Arrangement errors directly manifest as Ra roughness increases, scale streaking, and rolled-in oxide. Even sub-millimeter deviations propagate into visible defects through seven finishing stands.
- Cost: Every percentage point of surface-related downgrade carries six-figure annual penalties. The $50,000 alignment investment preventing these losses represents the highest-ROI capital allocation in most rolling mills.
- Efficiency: Optimized geometry reduces water flow by 20% while simultaneously increasing impact by 35–60%. The win-win equation—less resource consumption, higher quality output—is rare in heavy industry.
- Sustainability: Reduced water consumption and lower reheating energy directly translate to smaller carbon footprints per ton of finished steel.
- Actionability: A 7-step protocol exists, proven in CEM, hot-strip, and long-product mill environments.
Your Next Move
If your surface finish defect rate exceeds 1.5% of shipped tonnage, your descaling system warrants immediate diagnostic attention. Start with a mark-up paper test this week. The results will reveal more about your surface quality destiny than any downstream inspection station. Mills that have implemented this protocol consistently report breakthrough clarity: they finally understand why surface defects cluster in specific coil positions, why certain grades misbehave, and why night-shift production sometimes yields different quality than day-shift. The answer almost always traces back to headers.
For facilities managing complex spray systems across multiple process lines—including emission control, gas scrubbing, and cooling applications—precision nozzle engineering is the common denominator. Discover our complete range of spray optimization solutions, including High-Efficiency FGD & SCR/SNCR Denitrification Nozzles for Emission Control, engineered for maximum SO₂ and NOx removal efficiency in the harshest corrosive environments.
Request a Header Audit: Our application engineering team provides complimentary descaling system assessments for qualified metallurgical operations. Submit your mill configuration drawing and current surface defect Pareto for a tailored nozzle arrangement recommendation.